Ethereum carries the dollars, Base carries the swaps
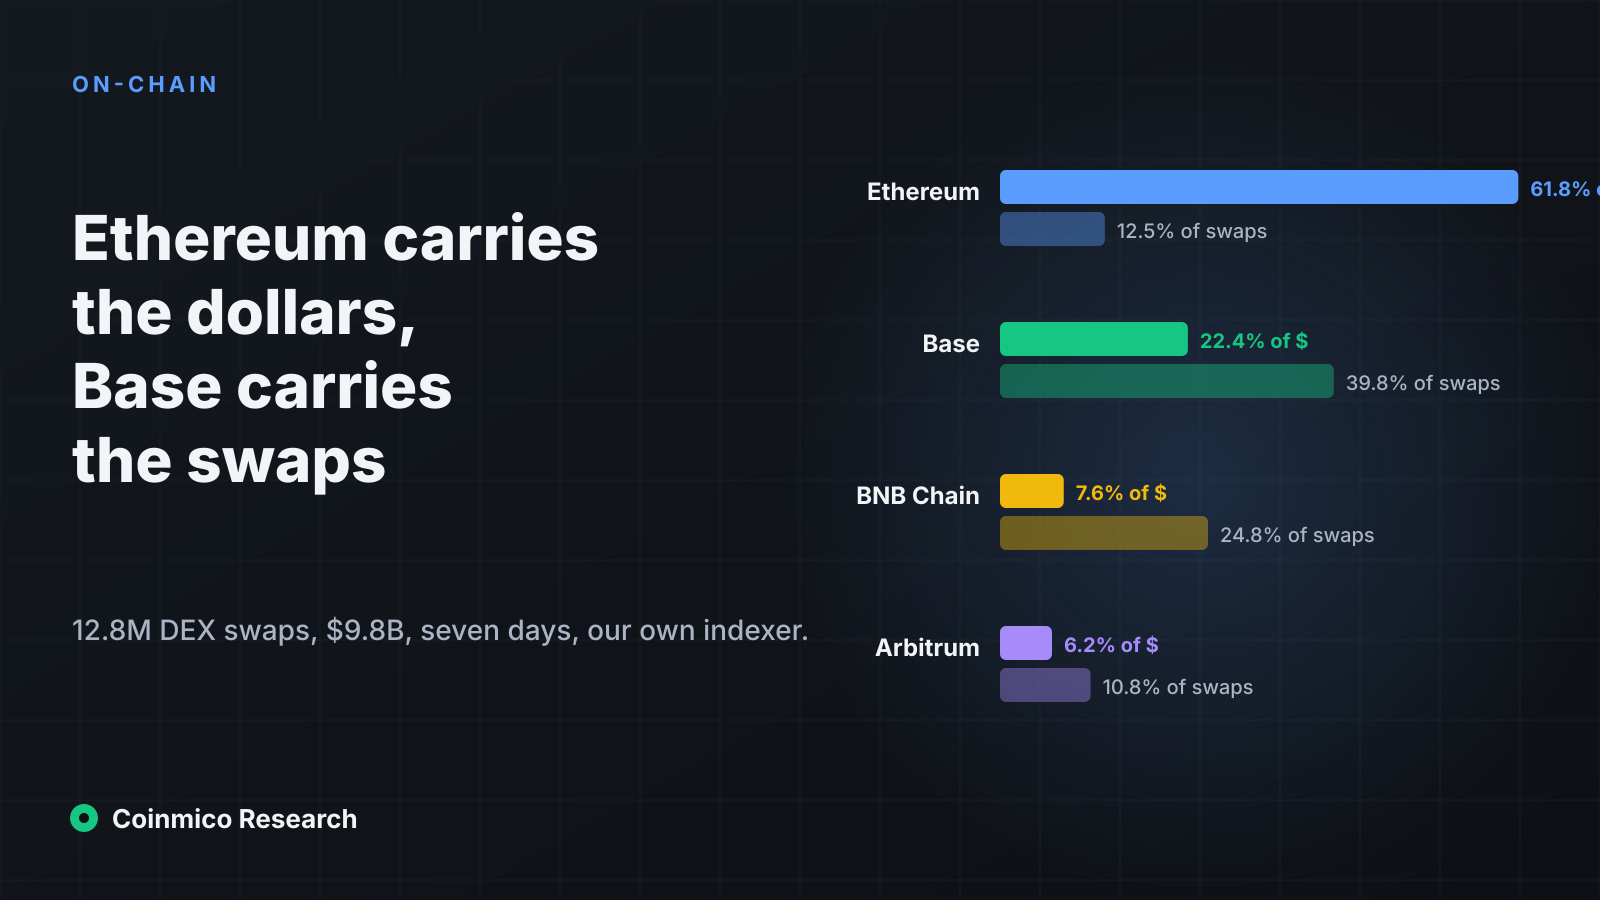
We indexed 12.8 million DEX swaps worth $9.8 billion over seven days. Ethereum mainnet produced 62% of the dollars from 12.5% of the swaps; Base produced 40% of the swaps for 22% of the dollars. The average trade on mainnet is $3,778. On BNB Chain it is $233.
Key findings
- Seven-day measured DEX volume across the chains we index was $9.8B from 12.8M swaps. Ethereum $6.05B (61.8%), Base $2.19B (22.4%), BNB Chain $0.74B (7.6%), Arbitrum $0.61B (6.2%); everything else under 1% each.
- Swap counts invert the order. Base 5.1M swaps (39.8%), BNB Chain 3.2M (24.8%), Ethereum 1.6M (12.5%), Arbitrum 1.4M (10.8%).
- Average swap size — Ethereum $3,778, Arbitrum $439, Base $429, BNB Chain $233, Solana $108 — is a cleaner measure of what each chain is for than either volume or count alone.
- 46% of Ethereum's DEX volume was stablecoin-to-stablecoin. Uniswap v4 now clears more on mainnet than v3 ($3.7B vs $2.2B), driven by USDC/USDT and USDT/USDS pools.
Most DEX league tables rank chains by dollar volume, and by that measure Ethereum mainnet still wins comfortably. But dollar volume answers one question — where does big money swap? — and hides another: where do _people_ swap? Our indexer reads every swap event from the pools we track, so we can answer both, and the two answers are almost mirror images.
All figures are seven days to 23 September, from our own on-chain indexing. Nothing is sourced from a DEX's reported statistics or from a third-party aggregator.
 EthereumETHAcross 50 spot markets we index
Two rankings, two different maps
| Chain | 7-day volume | Share of $ | Swaps | Share of swaps | Avg swap |
|---|---|---|---|---|---|
| Ethereum | $6,051M | **61.8%** | 1.60M | 12.5% | **$3,778** |
| Base | $2,191M | 22.4% | 5.11M | **39.8%** | $429 |
| BNB Chain | $742M | 7.6% | 3.18M | 24.8% | $233 |
| Arbitrum | $606M | 6.2% | 1.38M | 10.8% | $439 |
| Avalanche | $70M | 0.7% | 0.41M | 3.2% | $171 |
| Optimism | $39M | 0.4% | 0.52M | 4.1% | $76 |
| Polygon | $26M | 0.3% | 0.14M | 1.1% | $177 |
| Solana* | $19M | 0.2% | 0.17M | 1.3% | $108 |
| HyperEVM | $12M | 0.1% | 0.11M | 0.9% | $107 |
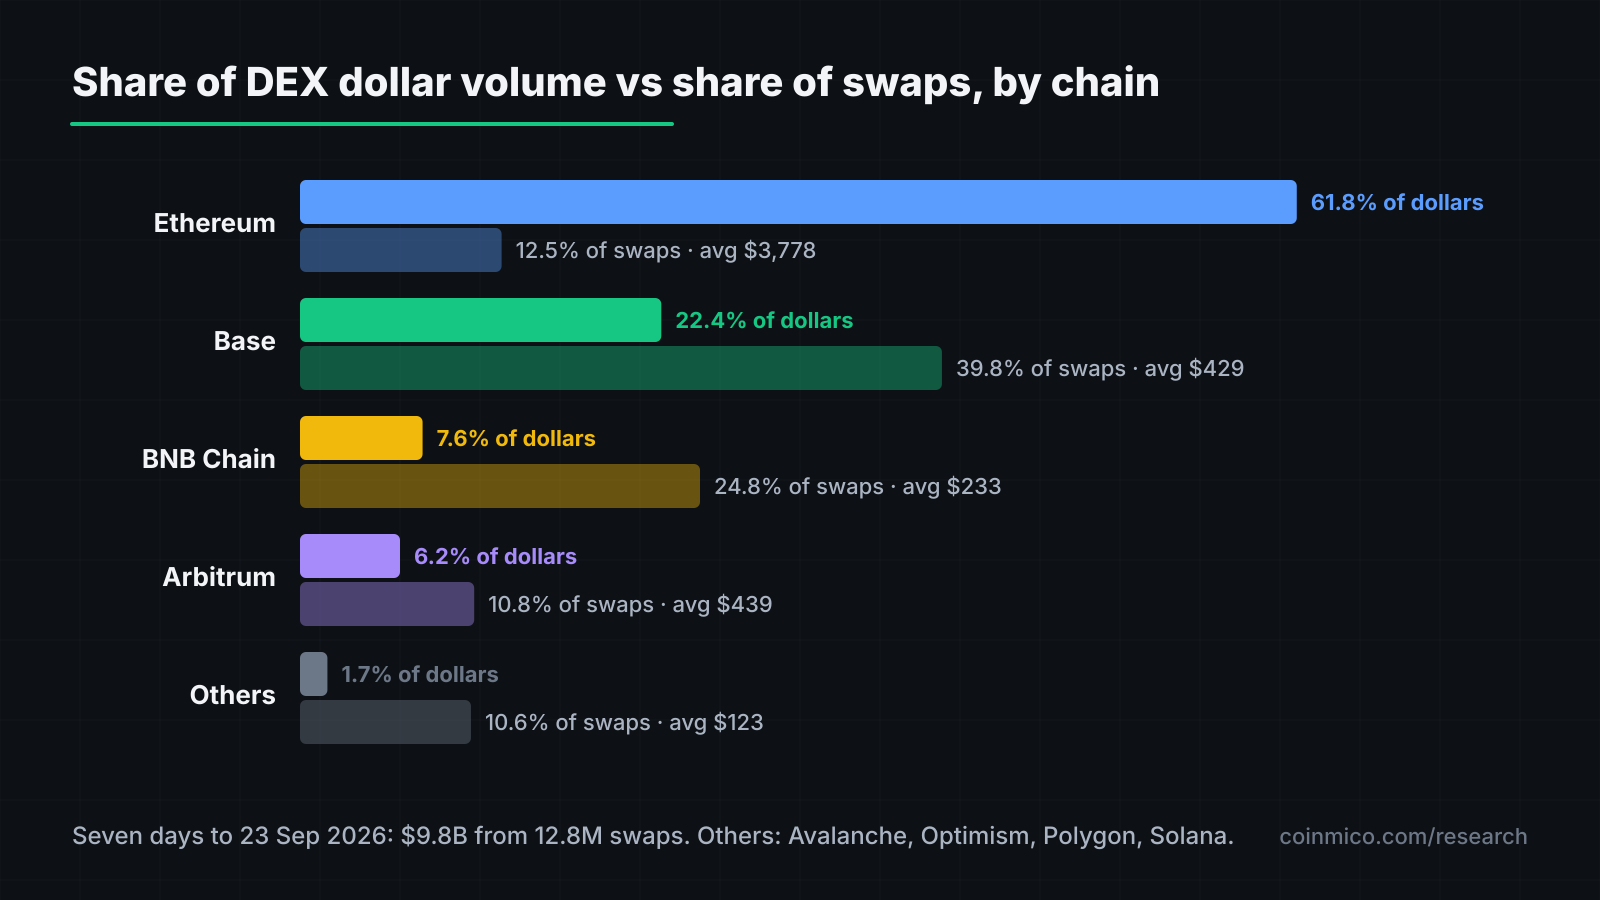
Read across the Ethereum row: one in eight swaps, five in eight dollars. Read across Base: two in five swaps, one in five dollars. BNB Chain is a quarter of all swaps we saw and less than a tenth of the money.
The average-swap column compresses this into one number per chain. A $3,778 average on mainnet is what you get when gas costs $1–5 per swap: small trades are priced out, so the pool is left with market makers, arbitrage bots, treasuries and whales. A $233 average on BNB Chain and $108 on Solana is what you get when a swap costs a cent: retail, memecoin trading, and bots doing many small trades because they can.
Base sits in between at $429, which is the more interesting position. It has mainnet's DEX design (Uniswap v3 and v4, Aerodrome's concentrated-liquidity pools) with L2 fees, and its swap count — 5.1M in a week, three times mainnet's — says the fee reduction has actually moved trading there rather than just moving bots.
Half of Ethereum's volume is stablecoins swapping into stablecoins
Break Ethereum's $6.05B down by what was being swapped and a large piece of the "big money" is not directional at all:
| Ethereum pair type | 7-day volume | Share |
|---|---|---|
| Stablecoin ↔ stablecoin | $2,798M | 46% |
| Everything else | $3,253M | 54% |
The largest single pools on mainnet were Uniswap v4 USDC/USDT at $1,487M, v3 USDC/WETH at $1,081M, v4 USDT/USDS at $720M, v3 WETH/USDT at $573M and v4 PYUSD/USDS at $295M. Three of the top five are stablecoin pairs. That is treasury management, market-maker inventory balancing and on-chain FX, not speculation. It is also why Ethereum's average swap is so large: a USDC/USDT rebalance is routinely six or seven figures.
Strip stablecoin pairs out and Ethereum's directional DEX volume is about $3.3B for the week — still the largest, but only 1.5× Base rather than 2.8×.
Uniswap v4 overtook v3 on mainnet
| DEX | Chain | 7-day volume | Swaps |
|---|---|---|---|
| Uniswap v4 | Ethereum | $3,717M | 553K |
| Uniswap v3 | Ethereum | $2,157M | 735K |
| Uniswap v3 | Base | $956M | 1.56M |
| Aerodrome (CL) | Base | $610M | 1.37M |
| PancakeSwap v3 | BNB Chain | $581M | 2.24M |
| Uniswap v3 | Arbitrum | $571M | 1.10M |
| PancakeSwap v3 | Base | $409M | 1.12M |
| Uniswap v2 | Ethereum | $126M | 203K |
| Uniswap v4 | Base | $115M | 616K |
| Aerodrome (v2-style) | Base | $95M | 369K |
Uniswap v4 clears 72% more dollar volume than v3 on Ethereum while doing fewer swaps — its average trade is $6,700 against v3's $2,900. The stablecoin pools above are almost all v4, which is where the hooks-based fee designs favour large low-slippage trades. On Base the picture is reversed: v3 and Aerodrome still dominate, v4 is fourth, and the average trade is a few hundred dollars. Same protocol family, different customers.
PancakeSwap on Base ($409M) is now more than two-thirds the size of PancakeSwap on its home chain BNB ($581M) — a migration worth watching.
Scale against centralised exchanges
For perspective, the $9.8B of DEX volume we measured over the week is about 2% of the $506B of spot volume we measured across 51 centralised exchanges in the same period. DEXs set the price for thousands of long-tail tokens that no CEX lists — 486 of the assets in our index are priced from DEX pools alone — but for the majors, price discovery is still overwhelmingly centralised.
What this means
- Judge a chain by average swap size, not by volume rank. Ethereum is a settlement layer for large, often non-directional flows. Base and BNB Chain are where the trade count is. Neither ranking alone tells you that.
- Stablecoin FX is a large, quiet market on Ethereum. Nearly half of mainnet DEX dollars are stablecoins swapping into stablecoins. Volume figures that do not separate this overstate speculative activity.
- Uniswap v4 is winning the large-trade segment. On mainnet it has overtaken v3; on L2s it has not. Watch whether Base's v4 pools grow into the gap.
- DEXs remain a rounding error for the majors. Two percent of spot. The interesting DEX story is coverage — the long tail — not share.
_Method note._ Volume is the USD value of each swap at the time of the block, priced from the pool's own quote-side token where it is a stablecoin or wrapped native, and from our index otherwise. Swap counts are individual swap events, not transactions; a route through three pools counts as three. \*Solana coverage is partial (PumpSwap, Raydium and Orca via log parsing) and understates that chain materially. Our BNB Chain indexer was stalled between 20 and 22 September and the chain is understated for that window. Robinhood Chain, which we began indexing in September, is excluded from these totals while we verify an anomalous print in a tokenised-treasury pool on 22 September.
Assets in this piece
 Ethereum
 BNB
BNB Uniswap
 Aerodrome Finance
Sources
- Coinmico on-chain swap indexer — Uniswap v2/v3/v4, PancakeSwap v3/Infinity, Aerodrome, Raydium, Orca and others
- Chain pages
Everything else in this piece is measured by Coinmico across the venues and chains we index. See our methodology.