CoinmicoCoinmico

Learn

How the crypto market works and how to read it. Every lesson shows the live figure it explains, measured by Coinmico across the venues and chains we index.

Start here

Stylised chain of ledger blocks, each linking to the previous one, with a green highlighted block at the end
Crypto basics

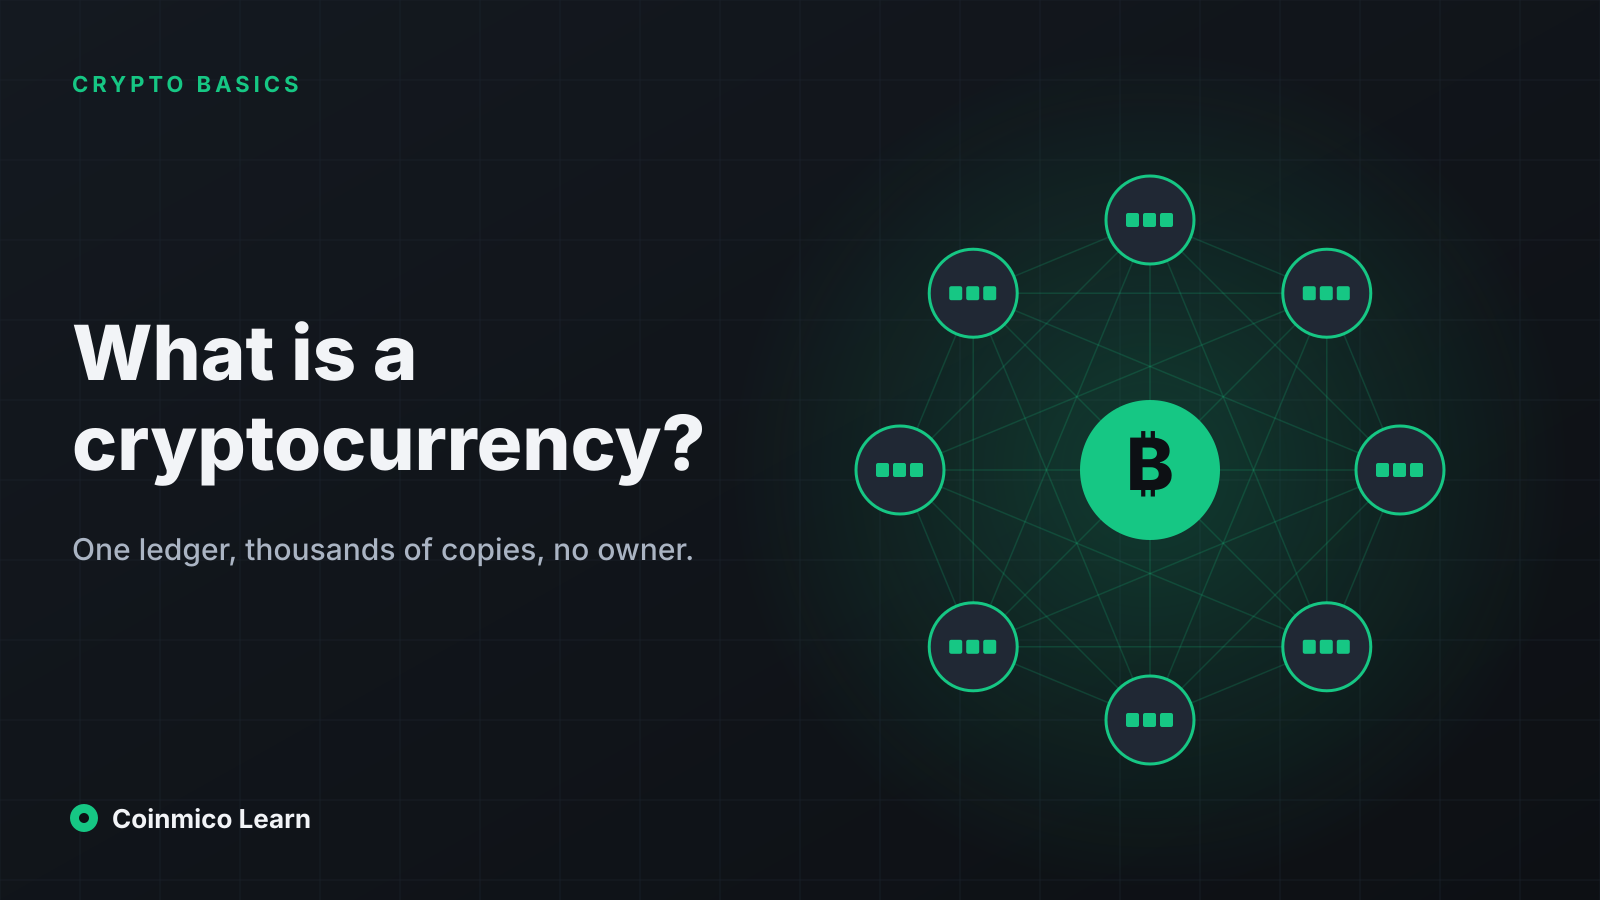
What a cryptocurrency actually is

Strip away the jargon and a cryptocurrency is three things working together — a shared ledger, a set of rules for changing it, and a unit that the rules count. This lesson walks through each one.

Coinmico Editorial·Sep 20, 2026·4 min read
Crypto basics

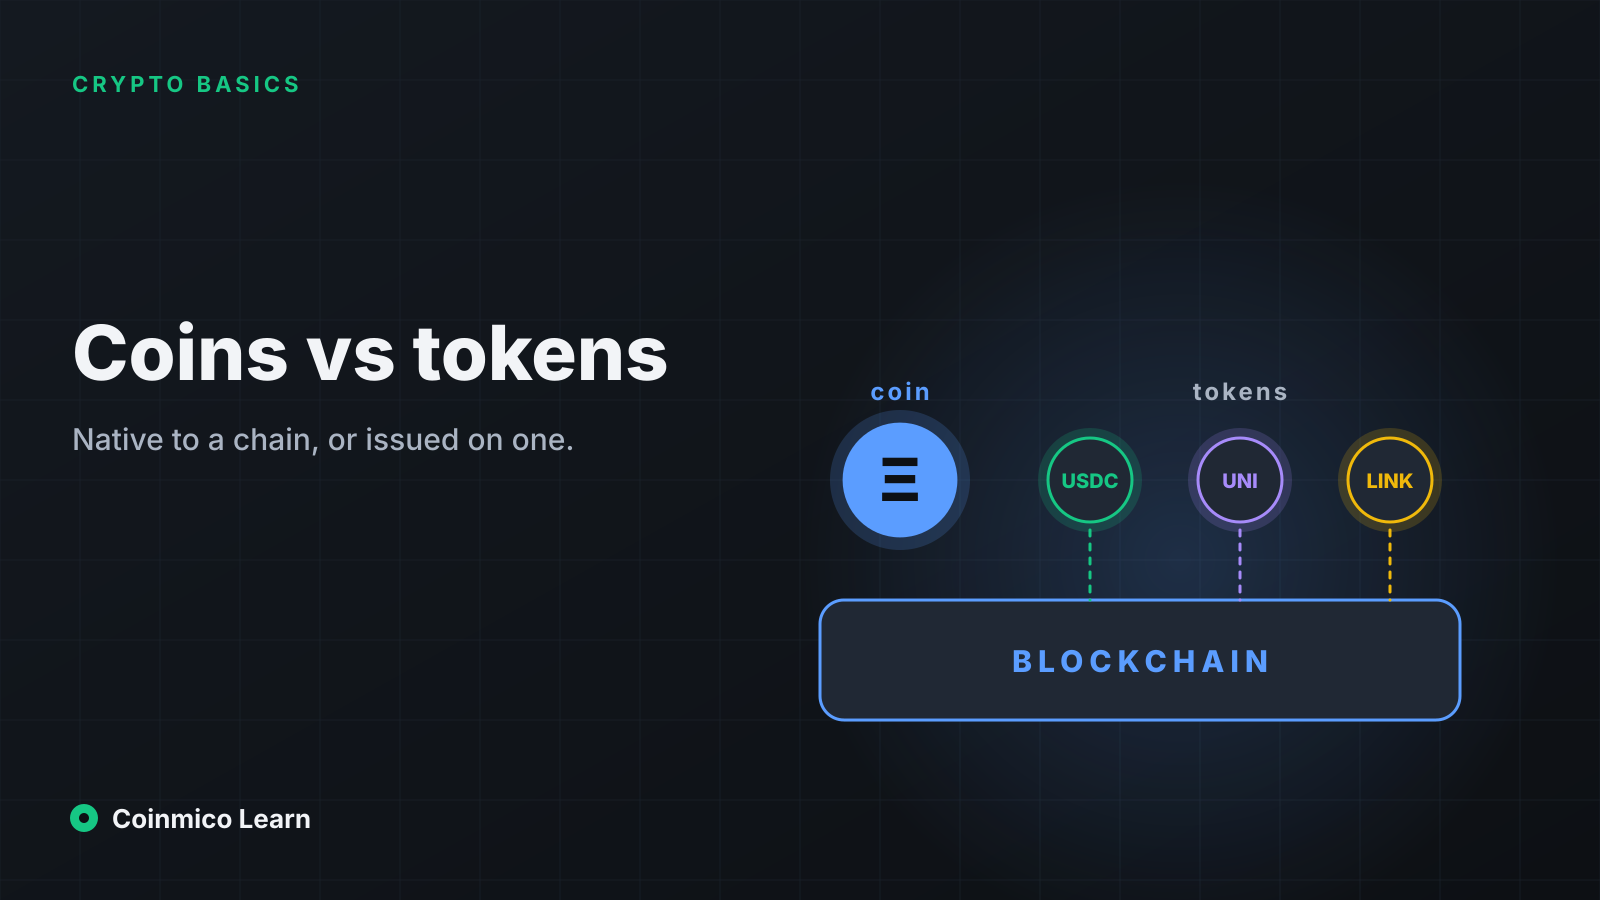
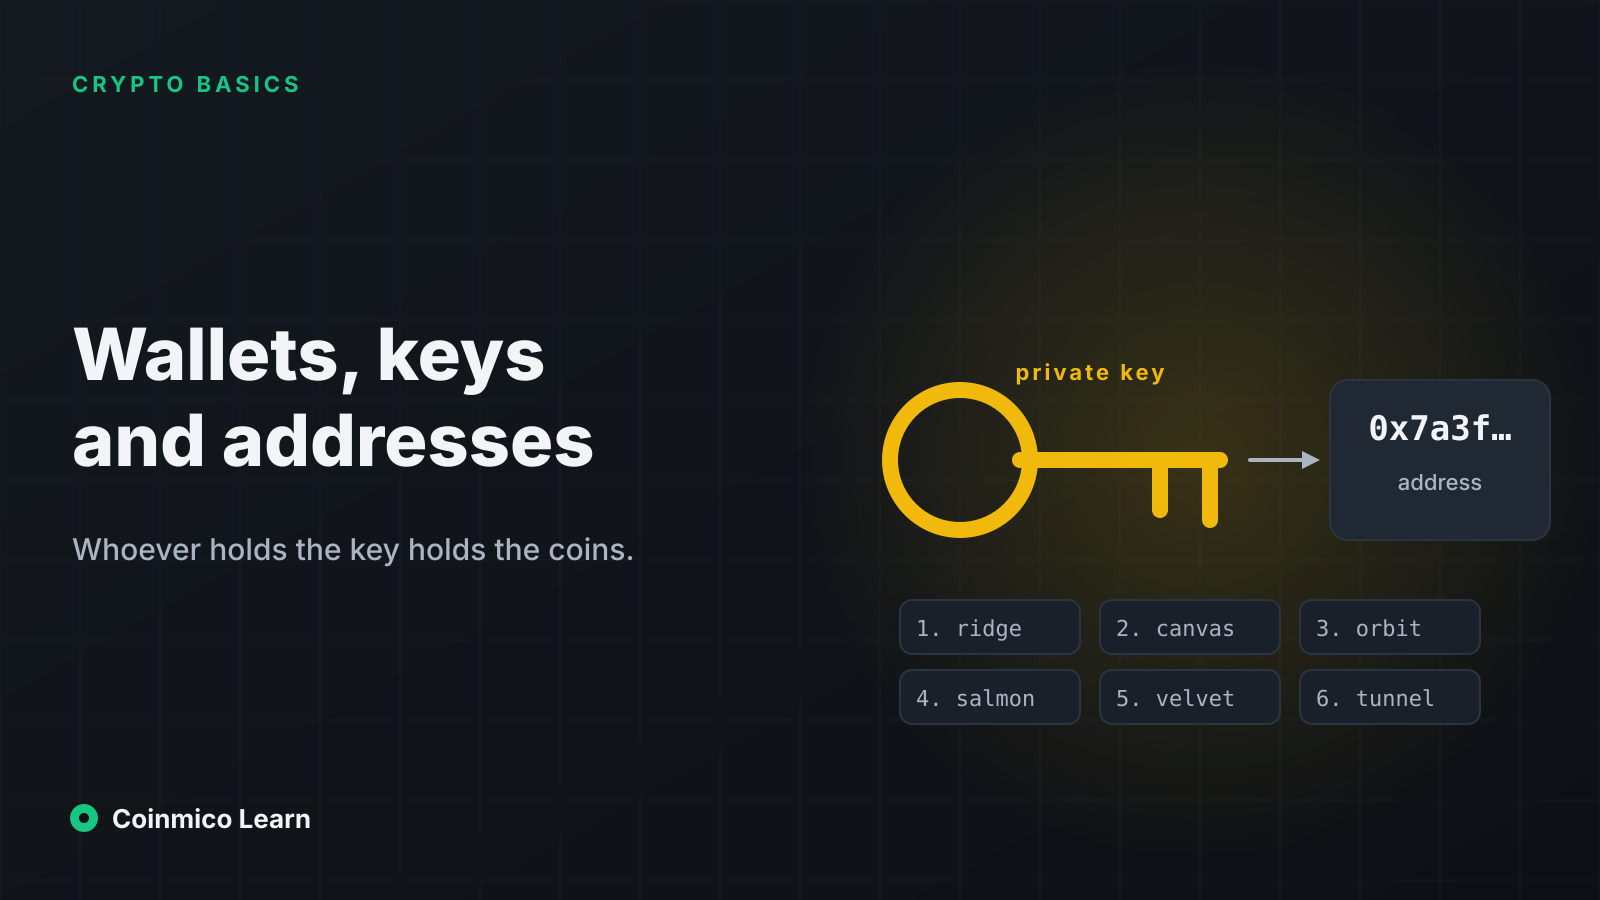
What a coin, a token, a wallet and an exchange are, and how they fit together.

All 4 lessons
Stylised chain of ledger blocks, each linking to the previous one, with a green highlighted block at the end
Crypto basics

What a cryptocurrency actually is

Strip away the jargon and a cryptocurrency is three things working together — a shared ledger, a set of rules for changing it, and a unit that the rules count. This lesson walks through each one.

Coinmico Editorial·Sep 20, 2026·4 min read
Reading market data

Price, volume, market cap, dominance and the ways each one can mislead.

All 5 lessons
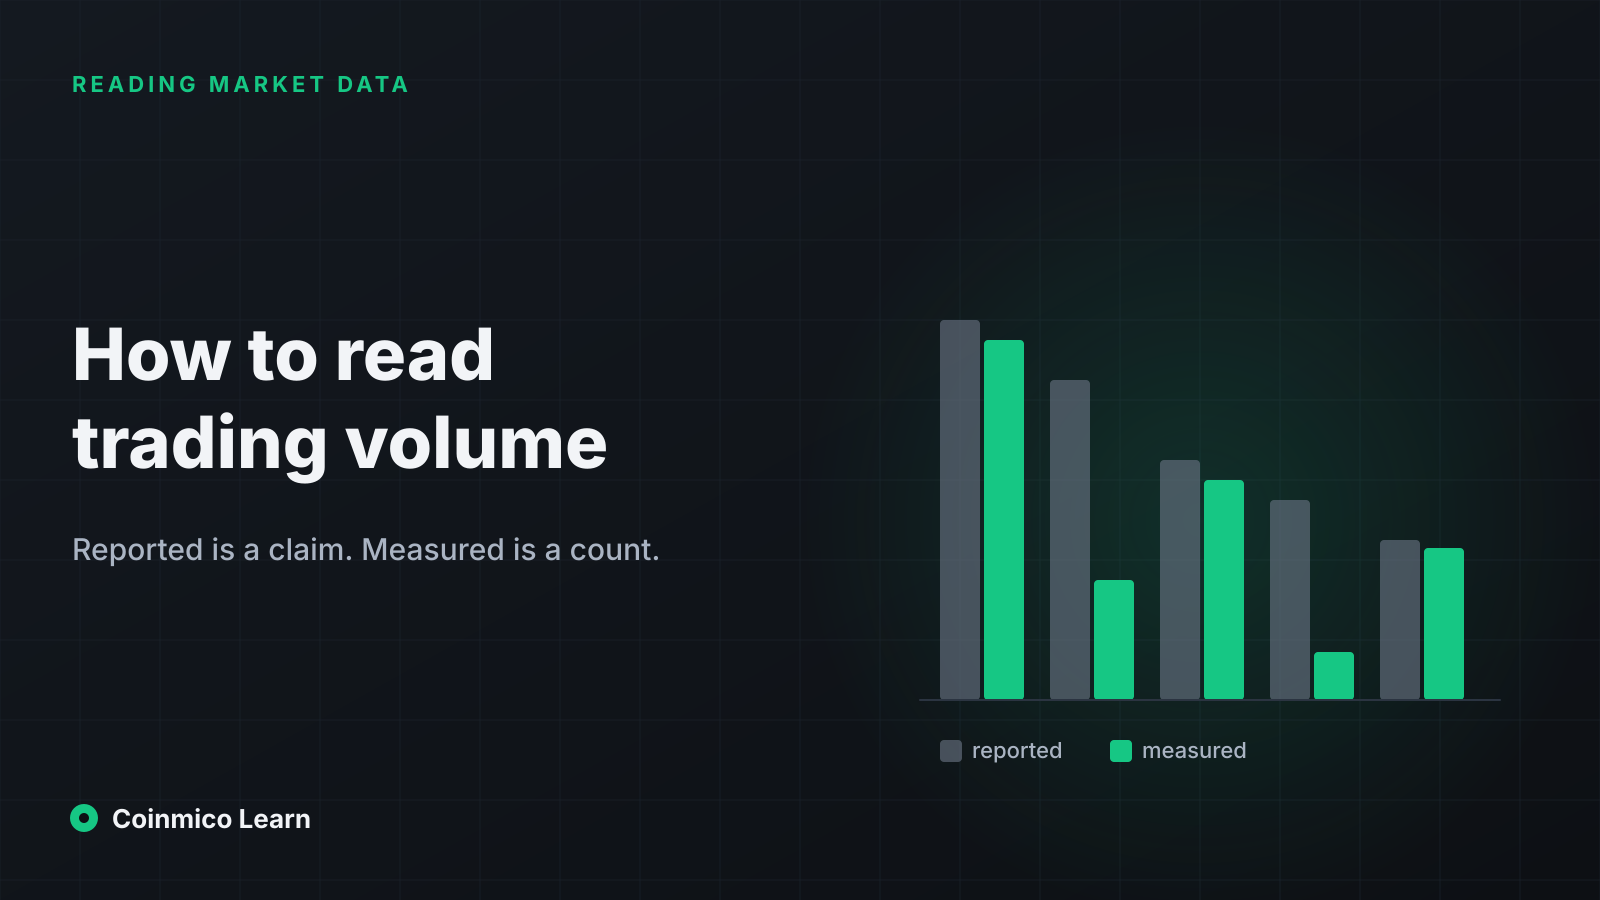
Two bar charts side by side — a tall hollow bar labelled reported and a shorter solid green bar labelled measured
Reading market data

How to read trading volume — reported vs measured

Volume is the figure that tells you whether a price is real. It is also the figure exchanges have the most incentive to exaggerate. Here is how to read it, where the distortions come from, and what changes when you count trades yourself.

Coinmico Editorial·Sep 20, 2026·4 min read
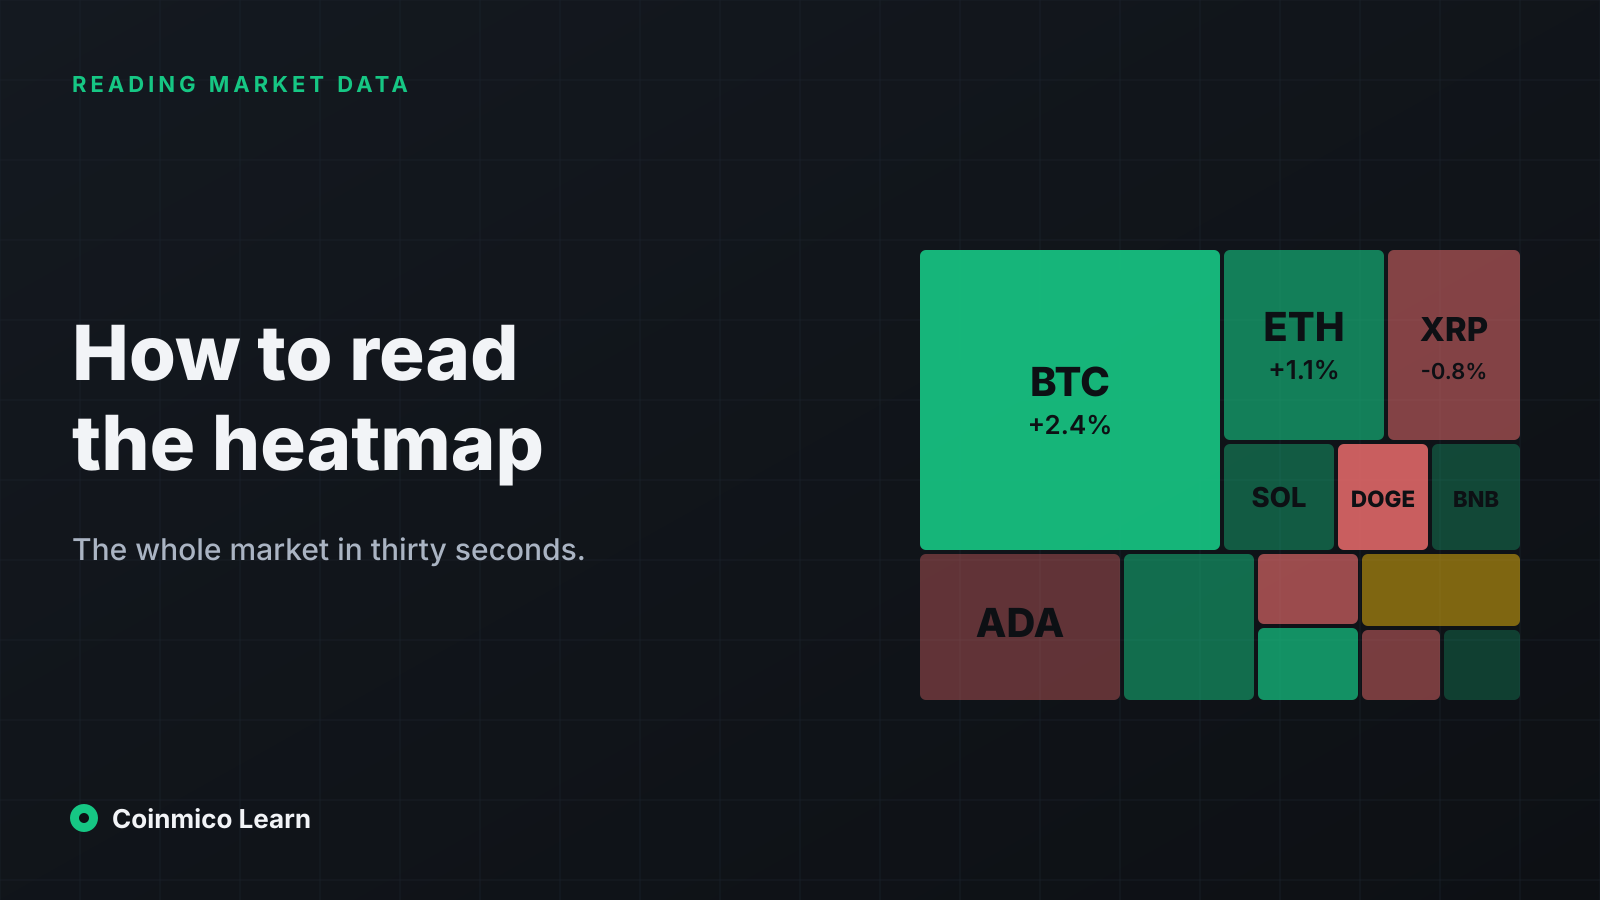
A treemap of rectangles sized by market cap and shaded from red to green, with bitcoin and ethereum as the largest tiles
Reading market data

How to read a market heatmap in thirty seconds

A heatmap shows the whole market on one screen — size as area, performance as colour. Read properly, it answers three questions a price list cannot: what is moving, whether the move is broad, and where the money is concentrating.

Coinmico Editorial·Sep 20, 2026·4 min read
Trading & derivatives

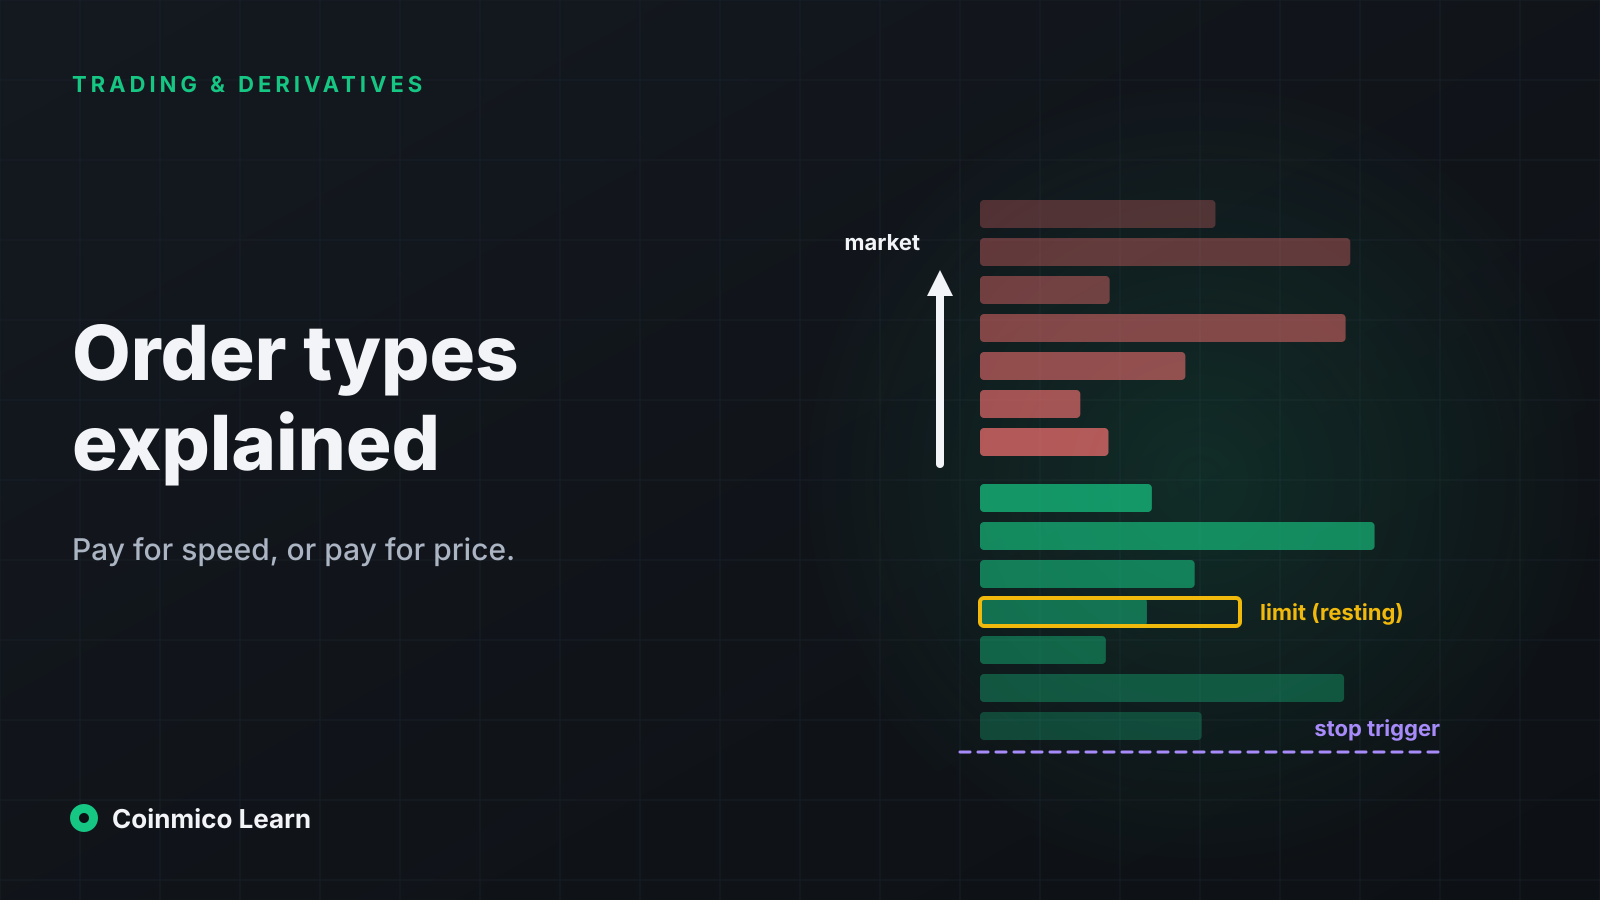
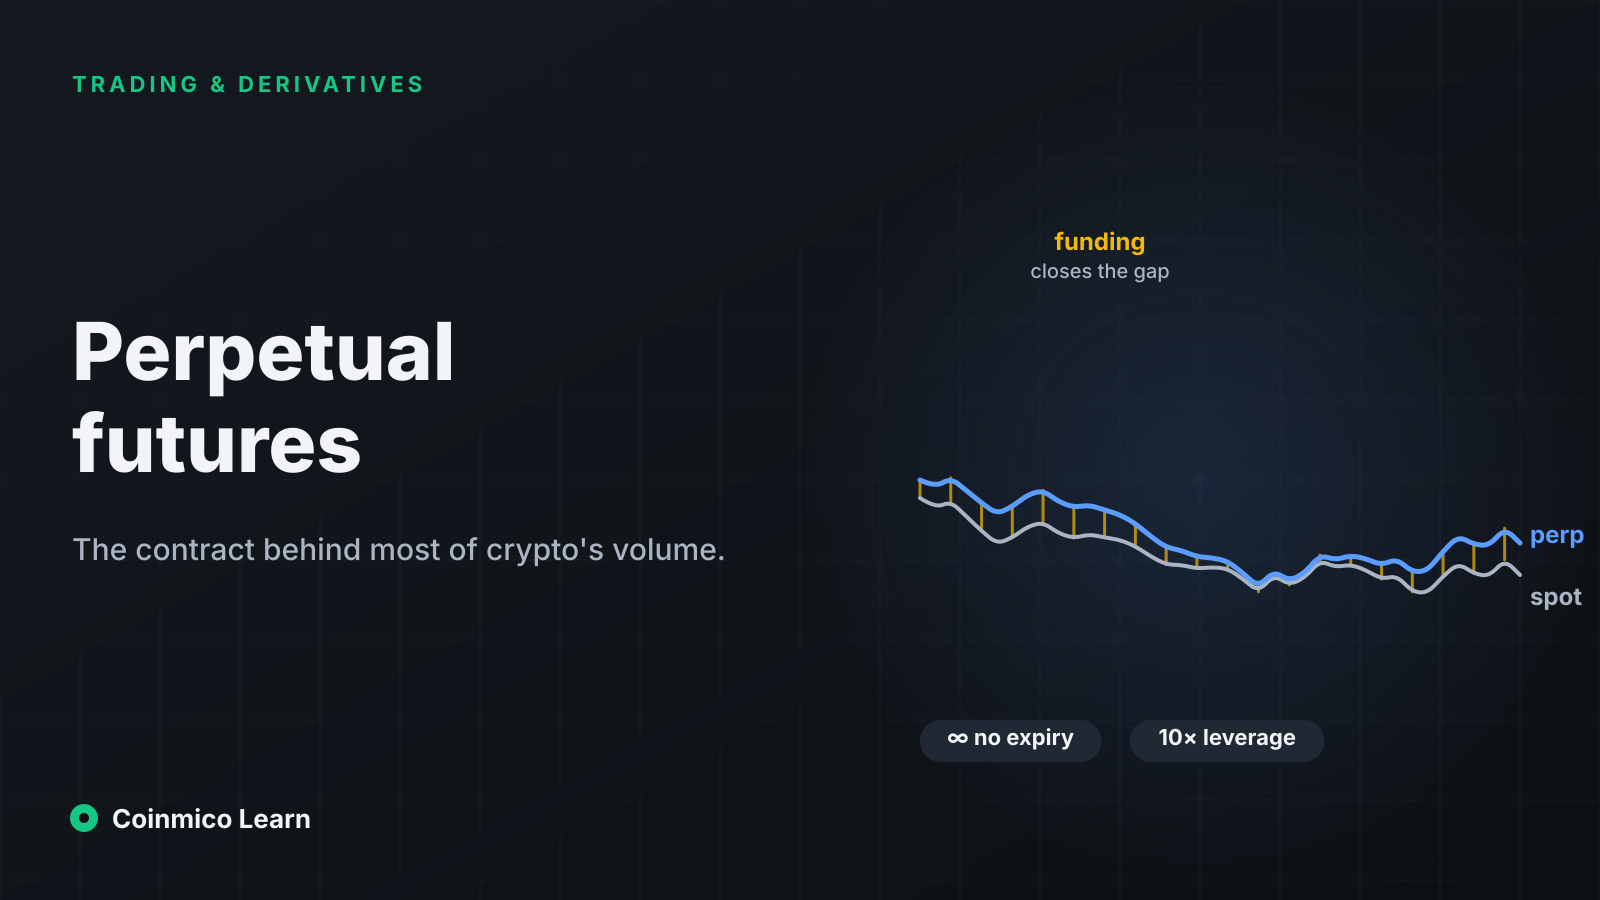
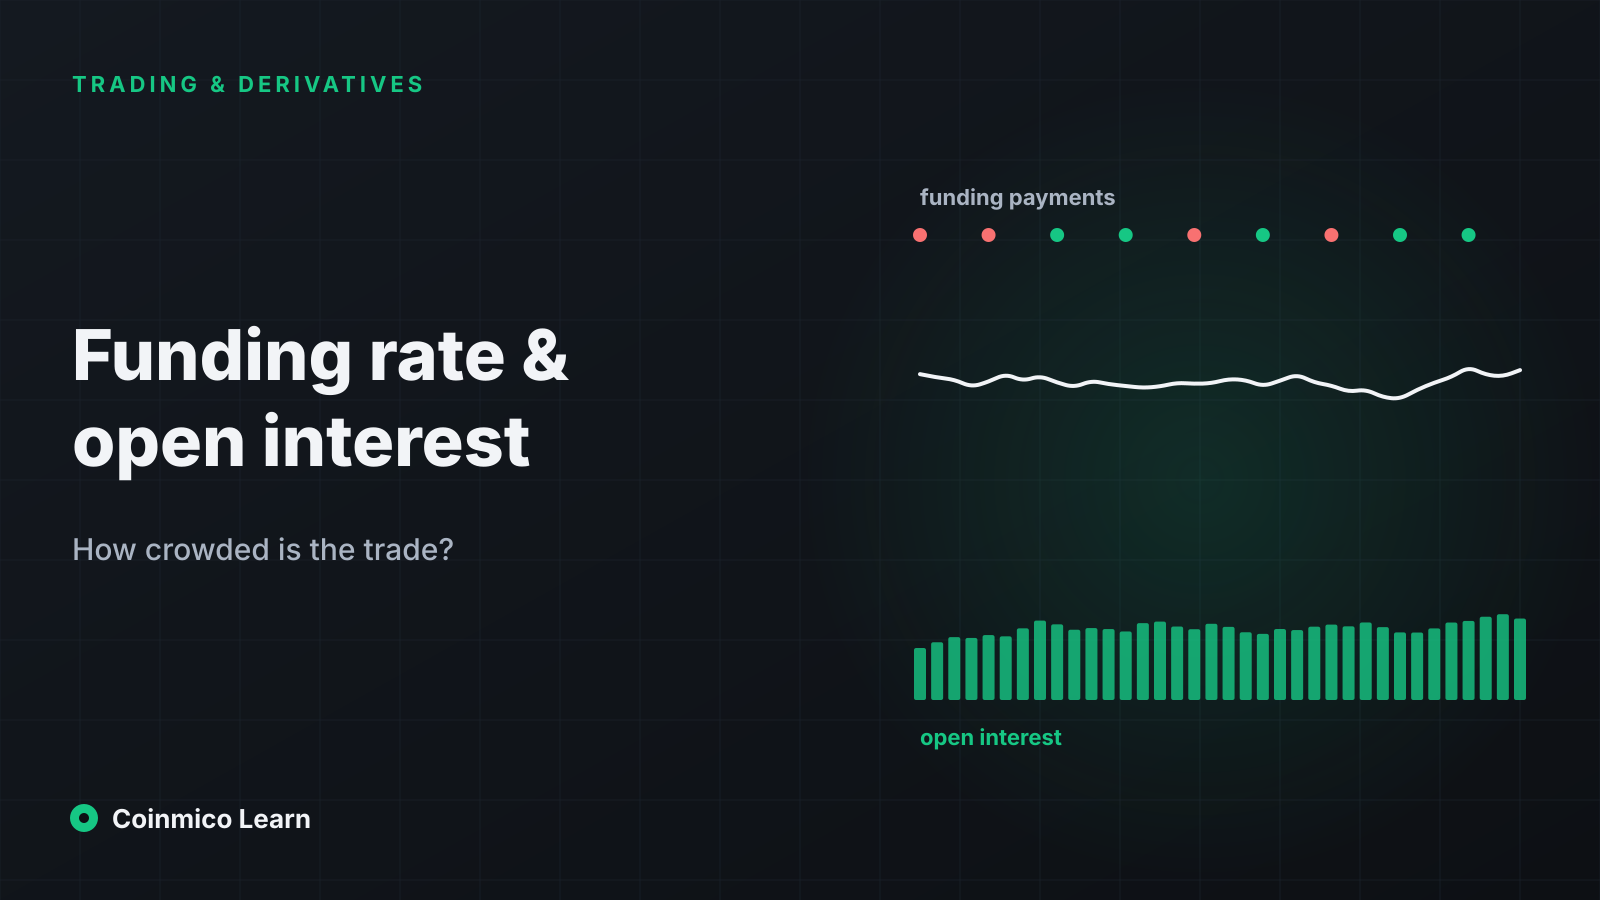
Order types, perpetuals, funding, open interest and liquidations, explained.

All 4 lessons

On-chain & DEXs

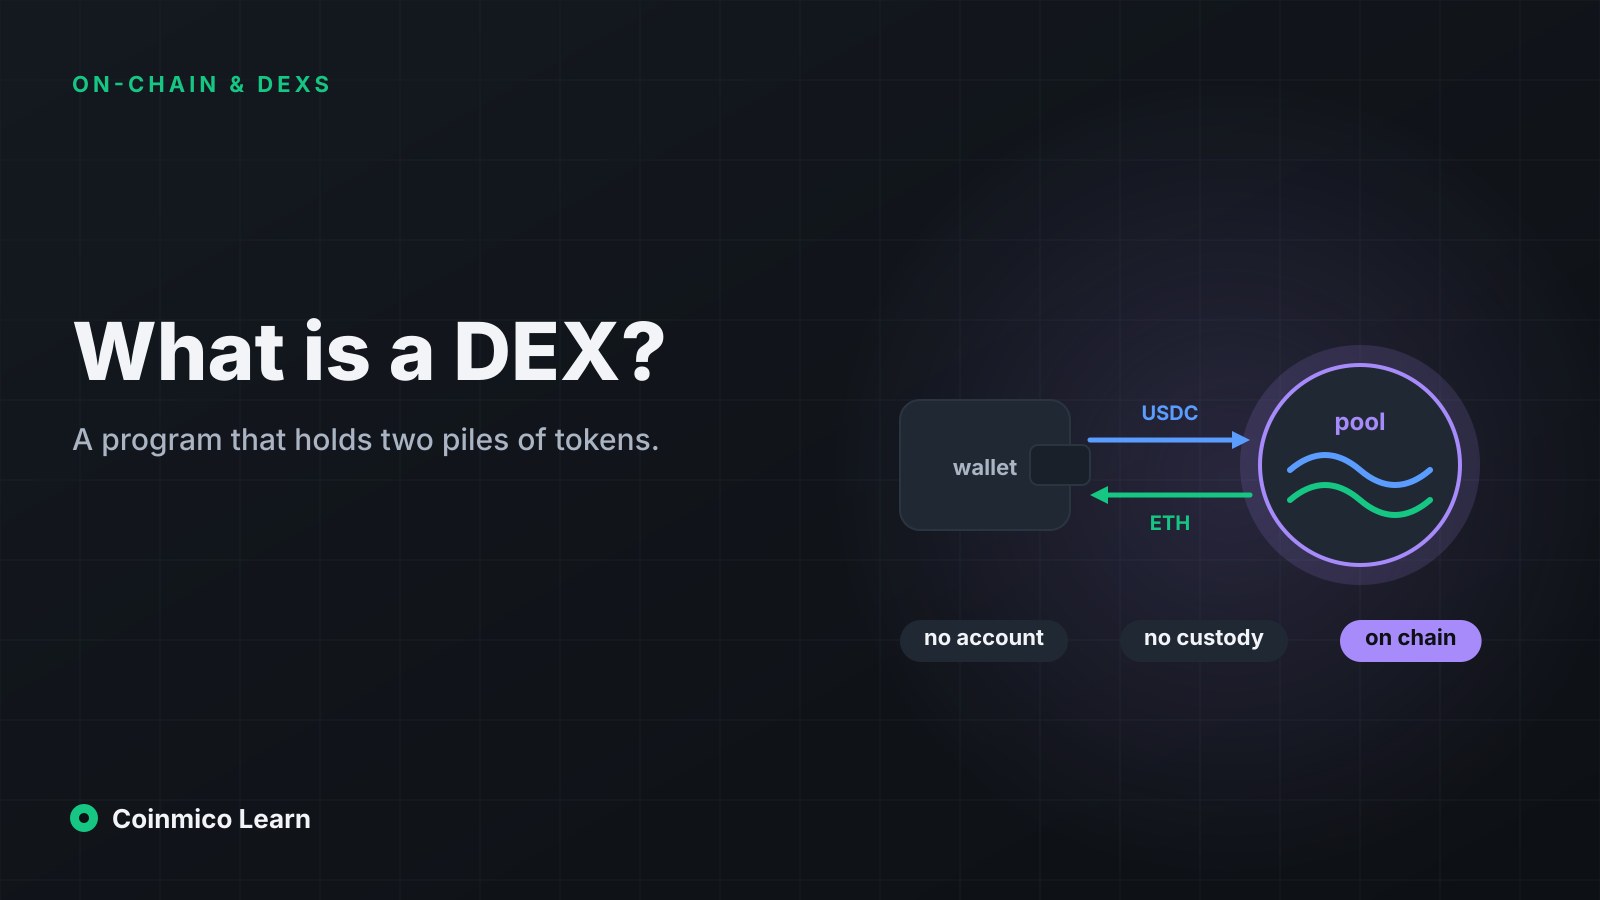
Liquidity pools, swaps, slippage and how a price forms without an order book.

All 4 lessons
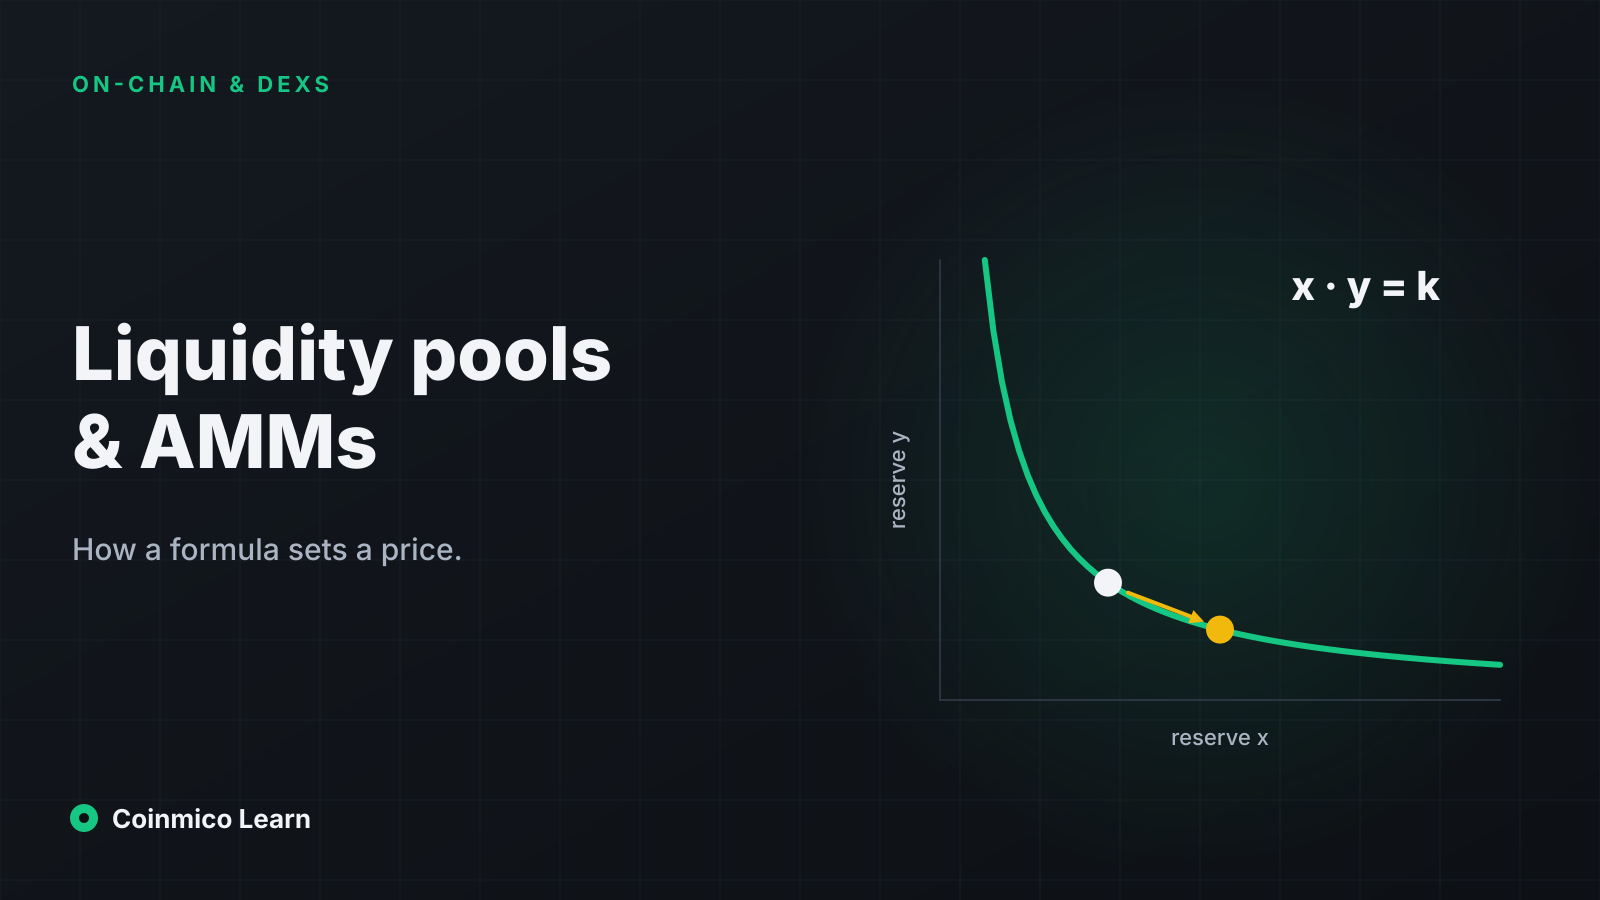
A hyperbolic curve labelled x times y equals k with a point sliding along it as reserves shift
On-chain & DEXs

Liquidity pools and AMMs: how a formula sets a price

A liquidity pool replaces every bid and ask in an order book with one equation. This lesson works through that equation with real numbers, shows why large trades get worse prices, and explains what liquidity providers earn and what they risk.

Coinmico Editorial·Sep 20, 2026·5 min read
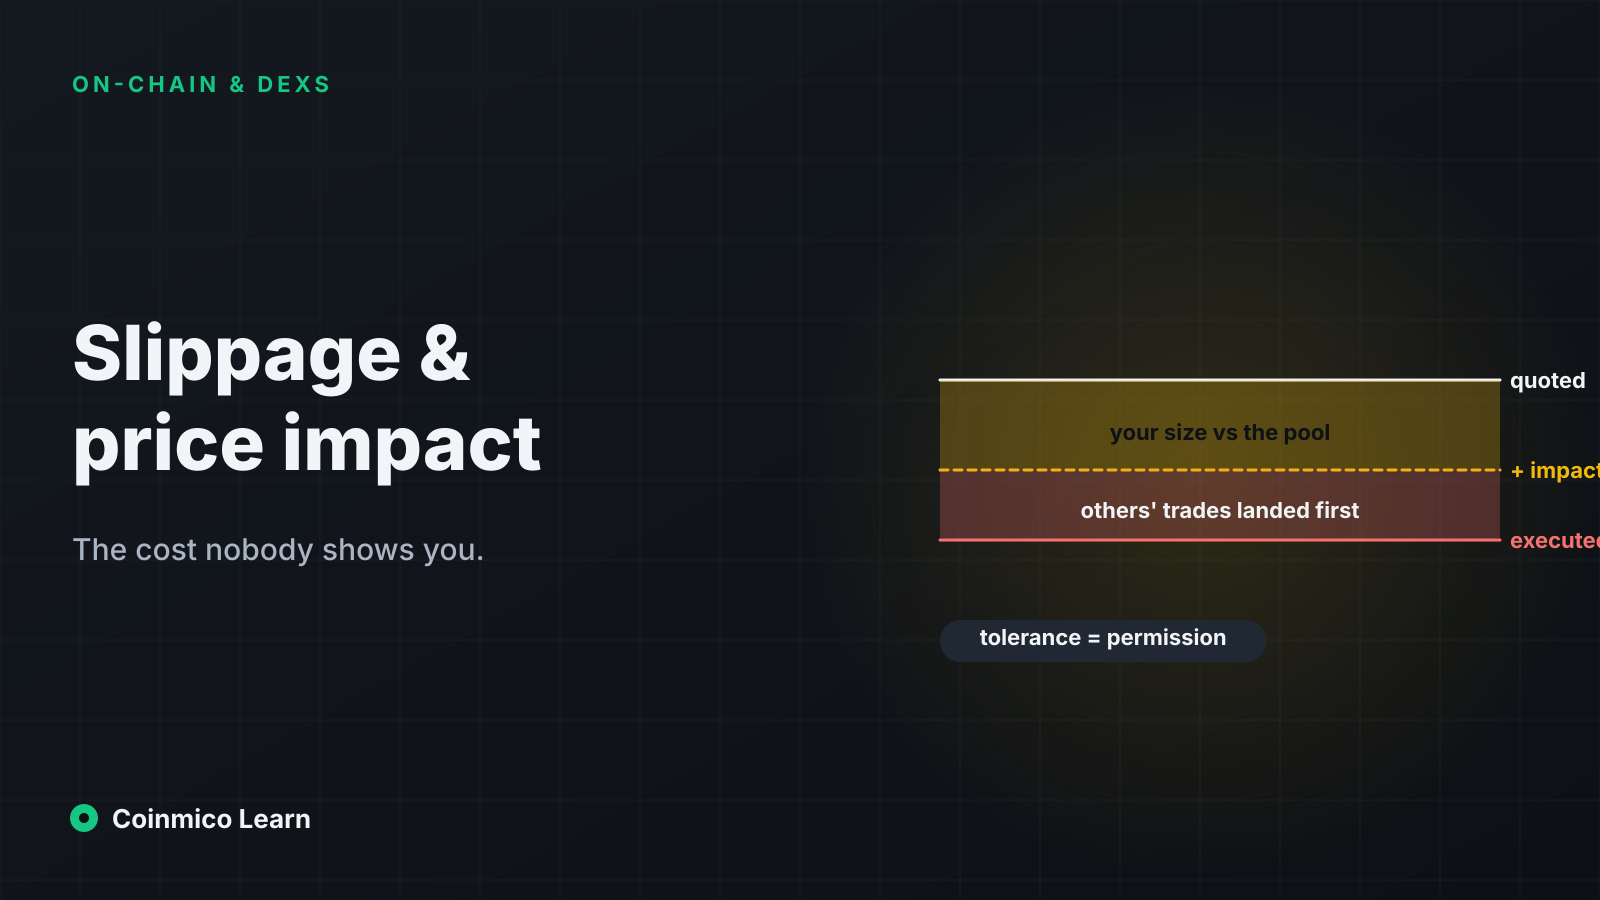
A quoted price marker and an executed price marker on a pool curve, with the gap between them shaded and split into impact and slippage
On-chain & DEXs

Slippage and price impact: the cost nobody shows you

Two different things hide under the word "slippage", and confusing them is how traders lose 5% on a swap without noticing. This lesson separates them, explains the tolerance setting, and shows how bots turn a loose setting into their profit.

Coinmico Editorial·Sep 20, 2026·5 min read

Security

Keys, seed phrases, custody and the scams that cost people the most.

All 3 lessons

Glossary

130 terms, each ending in the page on Coinmico where you can see the figure it describes.

Browse the glossary