Trade-size fingerprints: what volume rankings miss, including ours
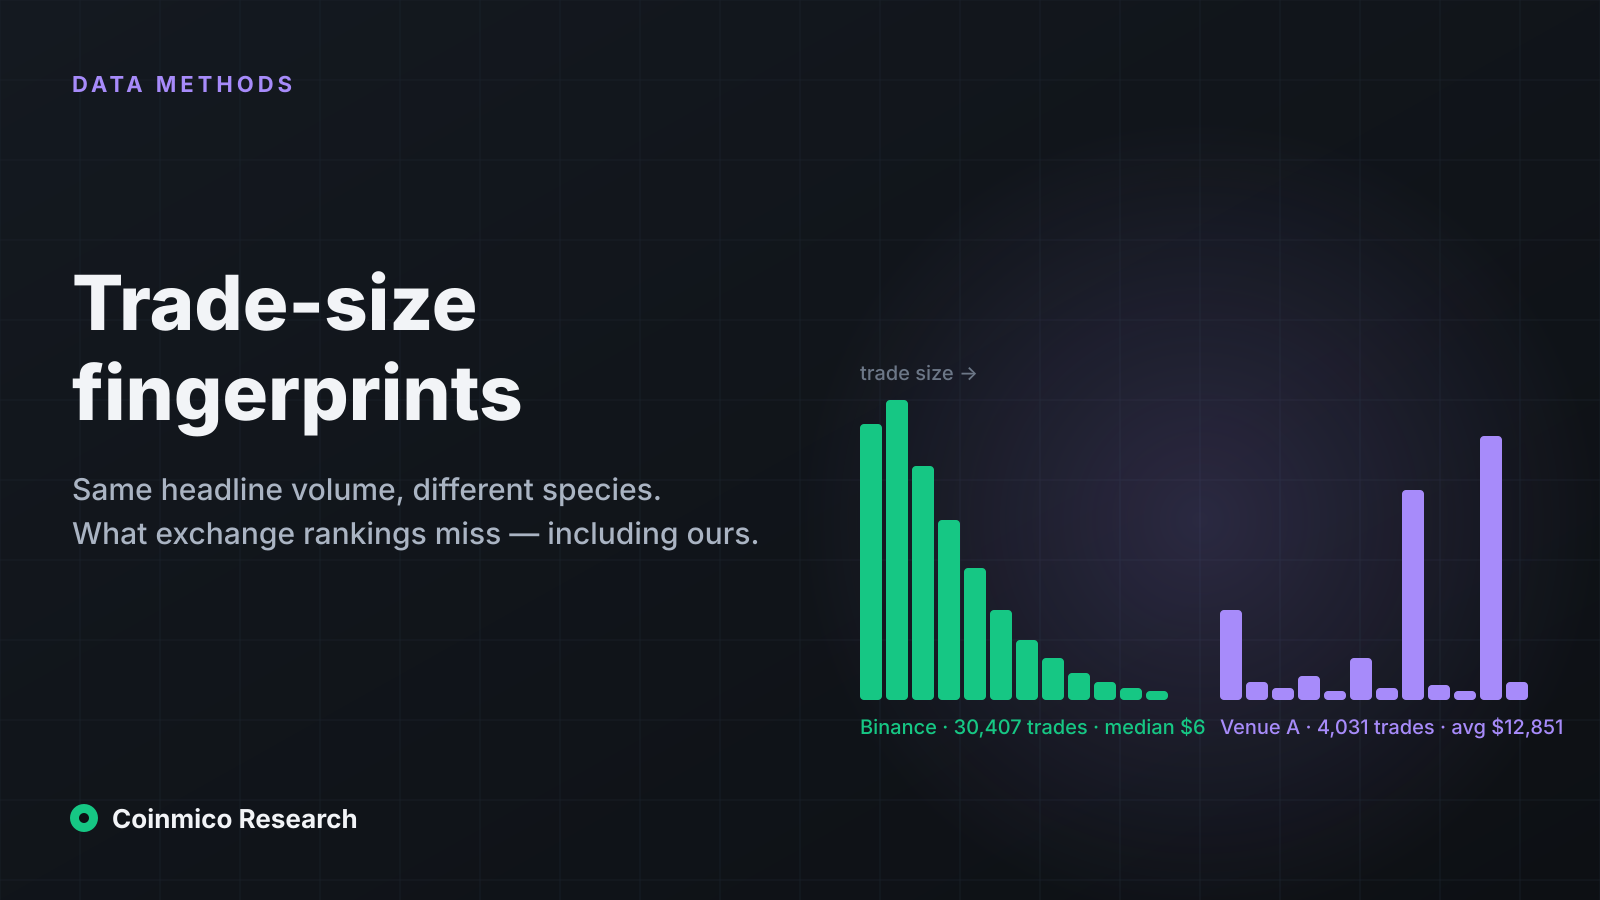
In six hours on 23 September, Binance printed 30,407 bitcoin trades at a median of $6. Another venue that out-ranks it on weekly volume printed 4,031 trades at a median of $1.55 — and an average of $12,851. The shape of the trades tells you more than the total, and it is the reason our index weights venues the way it does.
Key findings
- Every trade print carries a size. Across 51 exchanges the distribution of bitcoin trade sizes differs by two orders of magnitude between venues with similar headline volume.
- Binance, Coinbase and OKX show a retail-plus-algo profile: medians of $1–31, 90th percentiles of $1,000–3,400, tens of thousands of trades per six hours.
- Several venues that rank above Binance on seven-day bitcoin volume show averages of $6,400–40,800 per trade, 90th percentiles of $10,000–97,000, and a few hundred to a few thousand trades.
- We do not conclude from prints alone that any venue's volume is fabricated. We do conclude that raw volume is not a measure of where price is formed, which is why our index anchors on the cross-venue median before any volume weighting — and why our own exchange ranking, which is by measured volume, needs a trade-profile adjustment we have not shipped yet.
Reported volume is the easiest number in crypto to produce and the hardest to trust. An exchange can print any figure it likes to its ticker endpoint, and most aggregators re-publish it. We do not use reported volume anywhere. We connect to each exchange's public trade stream, record every individual print — price, size, side, timestamp — and add them up ourselves. That gives us _measured_ volume, which is better. But it also gives us something more useful than a total: the shape of the trades.
 BitcoinBTCAcross 50 spot markets we index
Two venues, similar volume, different species
Here is bitcoin spot trading on a selection of venues over a six-hour window on 23 September (05:00–11:00 UTC), from raw ticks:
| Venue | Trades | Volume | Average trade | Median trade | 90th percentile |
|---|---|---|---|---|---|
| Binance | 30,407 | $20.5M | $674 | **$6** | $976 |
| OKX | 5,253 | $8.6M | $1,635 | $31 | $3,417 |
| Bybit | 14,456 | $7.5M | $522 | — | — |
| Coinbase | 11,514 | $6.4M | $555 | **$1.08** | $1,067 |
| Venue A | 4,031 | $51.8M | **$12,851** | $1.55 | **$28,958** |
| Venue B | 7,824 | $50.1M | $6,399 | $399 | $10,444 |
| Venue C | 431 | $17.6M | **$40,760** | $2,224 | **$96,952** |
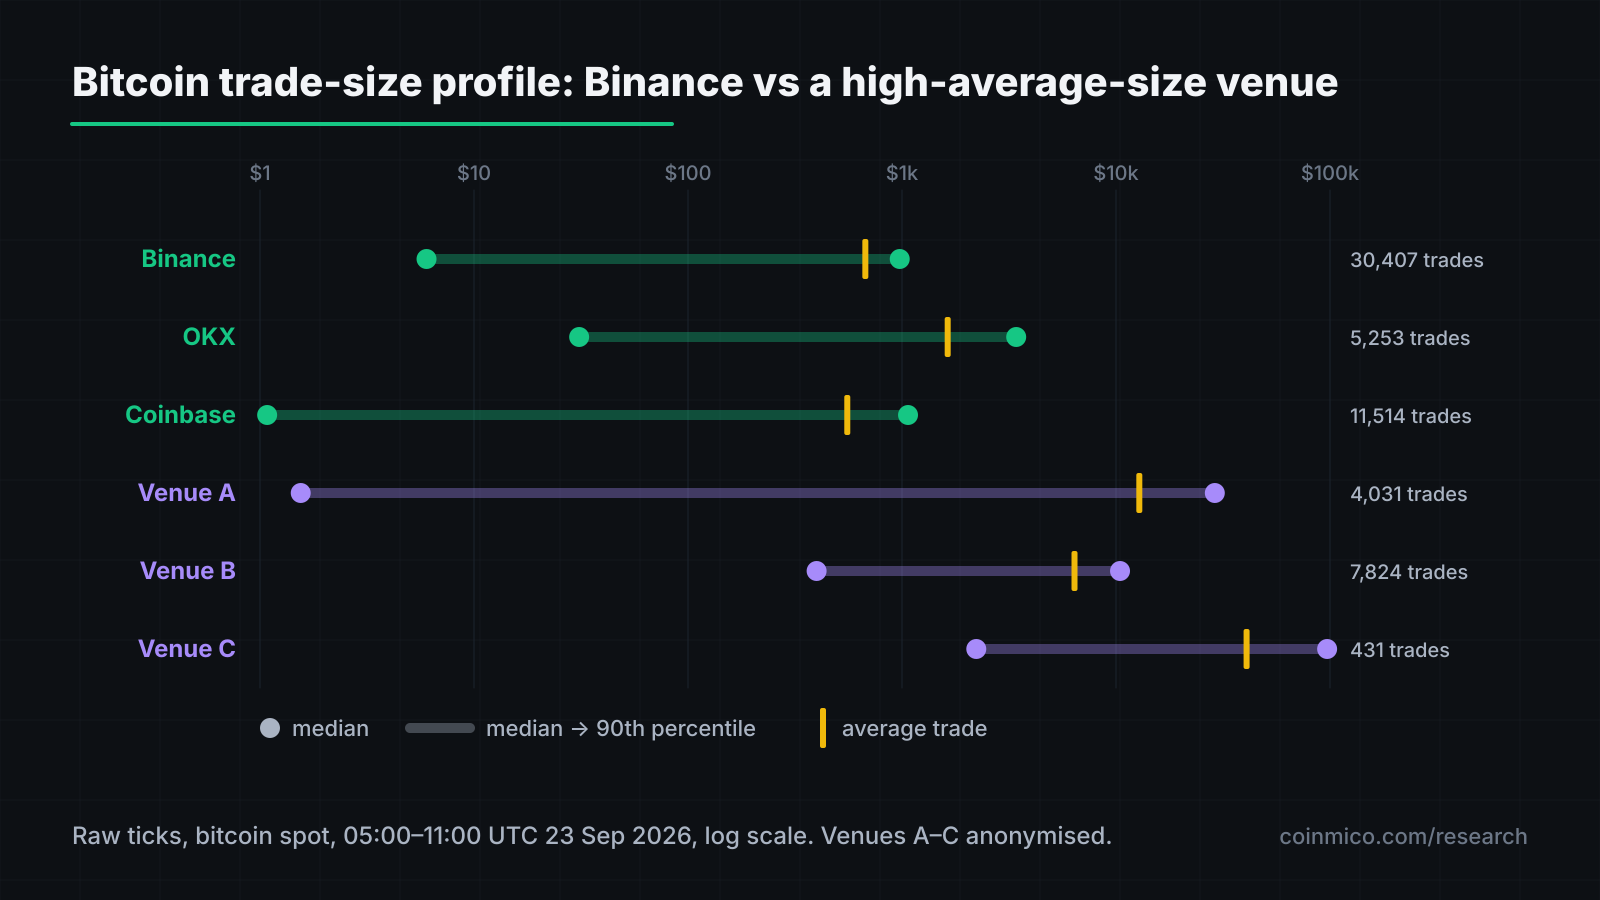
We have anonymised venues A–C because the point of this piece is the method, not a name-and-shame; every venue's measured volume by market is on its exchange page and you can draw the comparison yourself.
Look at Binance's row. Thirty thousand trades in six hours. Half of them under $6 — that is dust from grid bots, DCA orders, and retail buying $5 of bitcoin on a phone. Nine in ten under $1,000. And yet the total is $20M, because the volume sits in the long tail of a few hundred larger prints. Coinbase and OKX have the same shape at different scales: a dense pile of tiny trades with a thin tail of large ones. That is what an order book with many thousands of independent participants produces.
Now look at Venue A. Four thousand trades — an eighth of Binance's count — but two and a half times the dollar volume. The median is $1.55, so there _is_ a retail-sized pile. But the 90th percentile is $29,000 and the average is $12,851, which means the volume is coming from a set of very large prints that recur often enough to make one trade in ten a five-figure one. Venue C is more extreme: 431 trades, average $40,760, 90th percentile $97,000. Bitcoin trades of that size on Coinbase are rare enough to be individually visible; on Venue C they are the norm.
What we can and cannot conclude
A trade-size profile is a fingerprint, not a conviction. Legitimate explanations exist for a high-average-size venue:
- Market-making bots quoting and hedging in large fixed clips.
- Internalised OTC or institutional flow that a venue prints to its public tape as single large fills.
- Grid or copy-trading products that batch many users into one execution.
Less legitimate explanations also exist, and readers will be aware of them. We are not in a position to distinguish these from prints alone, and this article does not accuse any venue of anything.
What we _can_ say with confidence is narrower and, for a price index, sufficient: a venue where a few hundred large prints make up the volume does not represent a broad market of independent buyers and sellers. Its last price is a weaker signal of consensus than Binance's or Coinbase's, however large its total. A league table that ranks it above Binance on volume is ranking a different thing from "where bitcoin's price is discovered".
Over the seven days to 23 September, three venues with high-average-size profiles rank above Binance on measured bitcoin spot volume. Our own exchanges page ranks by measured volume across all pairs, and it reflects this: measured is better than reported, because at least the trades exist, but it does not yet distinguish a dense market from a sparse one with large prints. That is a gap in our product and this article is, in part, the case for closing it.
How this feeds the index
Our bitcoin price is not a simple volume-weighted average of every venue. It settles every two seconds like this:
- Each venue contributes one volume-weighted price for its window, from its own recent trades. Spot and perpetual markets on the same venue are separate buckets, and a perpetual carries a quarter of a spot market's weight.
- The cross-venue median is taken from the spot buckets. This is the anchor. A venue can print any volume it likes; it moves the median by exactly one vote.
- Venues more than 2% from that median are dropped as outliers. Persistent offenders are flagged at the market level — currently 303 markets carry a
price_outlierflag — as are the 729 markets in tokenised equities, which are a different asset class. - The survivors are weighted by traded notional, so within the 2% band the deepest markets do dominate the settle. Every settle records the venue count and a confidence value built from that count and the spread.
Step 4 is where the fingerprint matters. A venue with a high-average-size profile that stays inside the band _does_ carry weight in proportion to its measured volume — more than we think its profile earns. The median and the 2% band cap what that weight can do to the price, but we are honest that this is a bound, not a fix. Tempering volume weight by trade-count profile is on our list, and the profiles in this article are the data that will inform it.
The exchange ranking has the same gap. It orders venues by measured 24-hour volume, which is the right raw material and the wrong sort key on its own. The change we intend is to show trade count and a size-profile indicator beside every volume figure, and to let the ranking be sorted by them, so that the two species of venue in the table above are visible as different rather than adjacent.
The rest of the coverage picture
The same trade-level approach is what lets us say precisely what we do and do not know about each coin. As of 23 September:
| Count | |
|---|---|
| Assets tracked | 2,414 |
| Priced from our own trades in the last 24h | 1,789 |
| — from a multi-venue index | 1,136 |
| — from a DEX pool | 486 |
| — from a single venue's trades | 118 |
| — from an order book mid (no trades) | 31 |
| Shown at a listing reference price (no measured trade) | 18 |
| Spot markets connected | 21,208 |
| Perpetual and futures markets connected | 4,375 |
| DEX pools discovered | 3.6M |
Six hundred and twenty-five assets — a quarter of the list — had no trade we could measure in 24 hours. Most have no market on any of our 51 venues; 179 have markets that are all excluded as outliers or tokenised equities. Those coins show a reference price on their page with a label saying so. The alternative — quietly displaying someone else's number as if we had measured it — is what we built Coinmico to avoid.
| Coin | Price | 24h | 24h volume | Market cap |
|---|---|---|---|---|
| BitcoinBTC | $84,077.16 | 2.83% | $21.02B | $1.69T |
 EthereumETH EthereumETH | $2,663.72 | 3.16% | $9.39B | $325.2B |
 USDCUSDC USDCUSDC | $1.00 | 0.02% | $5.61B | $75.14B |
 XRPXRP XRPXRP | $1.50 | 4.77% | $3.92B | $94.27B |
 SolanaSOL SolanaSOL | $114.21 | 3.04% | $2.63B | $67.11B |
 ZcashZEC ZcashZEC | $1,525.93 | 1.98% | $1.81B | $25.86B |
 NEAR ProtocolNEAR NEAR ProtocolNEAR | $4.35 | 1.99% | $1.48B | $5.69B |
 TetherUSDT TetherUSDT | $0.9999 | 0.03% | $1.19B | $183.5B |
What this means
- Ask any volume figure two questions: how many trades, and what does the distribution look like? A total without a count is a claim, not a measurement.
- Rankings by volume reward the wrong thing. A venue can print its way to the top of a league table. It cannot move a cross-venue median by more than one vote.
- Our numbers are lower than reported ones, and that is the point. When our measured bitcoin volume is below an exchange's own headline figure, the difference is what we could not verify.
- The coverage table is a promise. When a coin's page shows a listing reference price, we have not measured it. When it shows an index price with a venue count, we have.
_Method note._ Trade-size statistics use raw ticks (every individual print) for bitcoin spot markets not flagged as excluded, over 05:00–11:00 UTC on 23 September 2026. Medians and 90th percentiles were computed for the venues where they are shown; Bybit's are omitted only because they were not part of the sampled set. The settle procedure and outlier tolerances are described on the methodology page. Asset counts are as of the same day and change daily as venues list and delist.
Assets in this piece
 Bitcoin
Sources
- Coinmico raw trade feed (ticks), 51 centralised exchanges
- Coinmico exchange ranking by measured volume
Everything else in this piece is measured by Coinmico across the venues and chains we index. See our methodology.