Where bitcoin actually trades: a week of measured spot volume
Bitcoin changed hands for $130 billion on spot markets last week, on our count. Five-sixths of it was priced in Tether, one-fourteenth in bank-account currencies, and a fifth of every day's trading happened in three afternoon hours.
Key findings
- Across 51 exchanges we measured $130B of bitcoin spot volume in the seven days to 23 September, against $77B in perpetual swaps and $4.5B in inverse contracts.
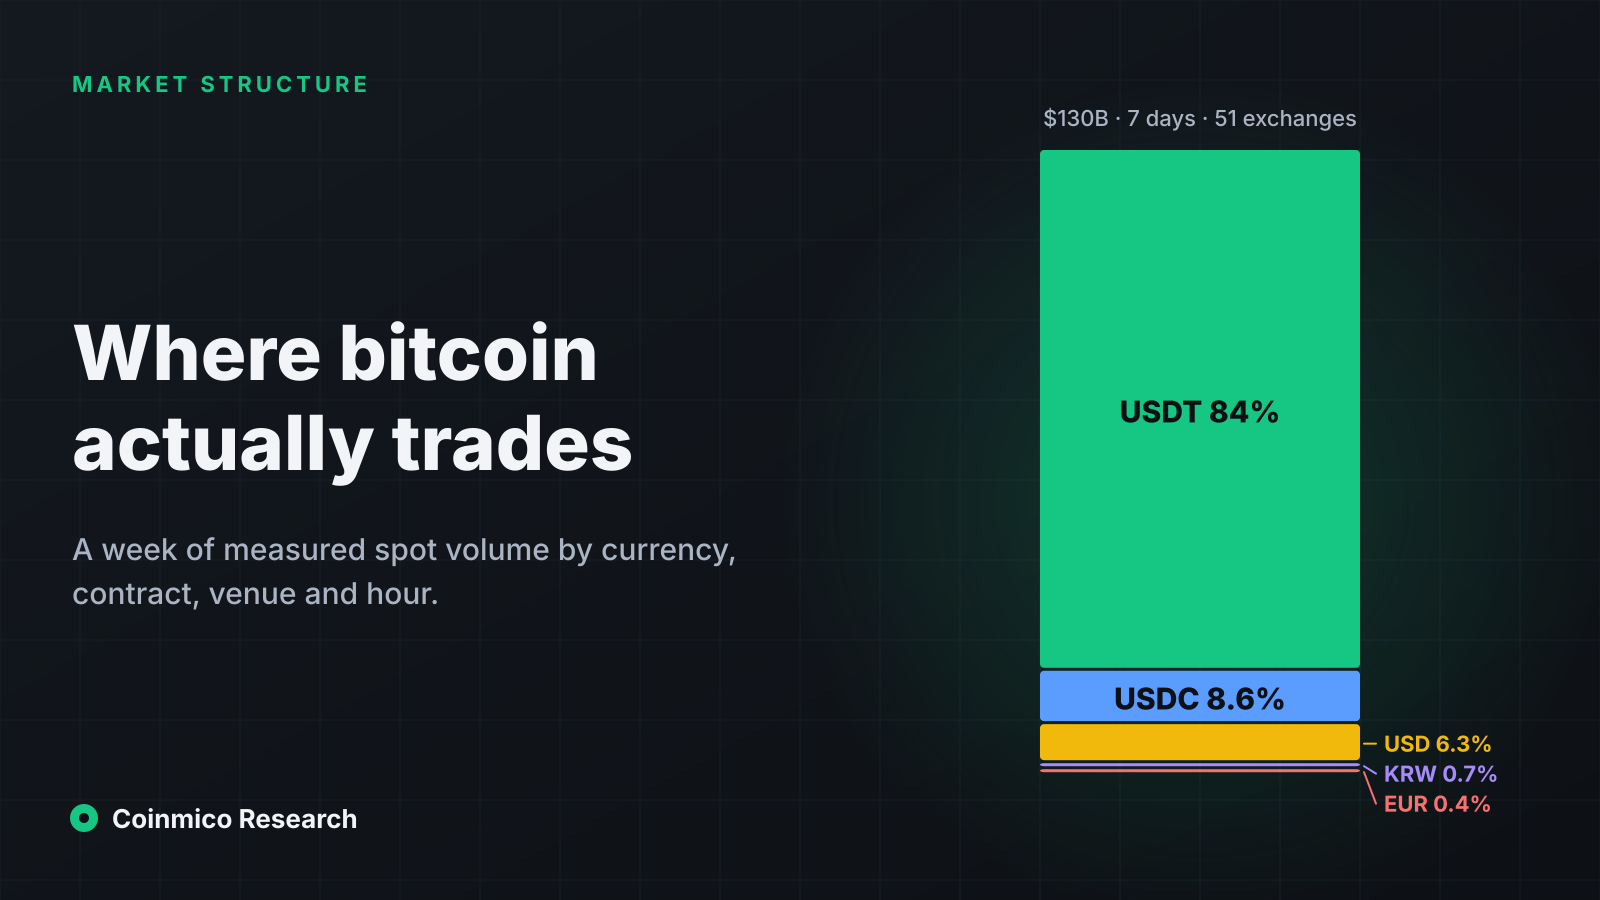
- USDT quoted 84% of that spot volume. USDC took 8.6%, US dollars 6.3%, Korean won 0.7% and euros 0.4%. Every other currency combined was under 0.1%.
- Volume peaks between 13:00 and 16:00 UTC, when the European afternoon meets the US open. The busiest hour runs at 2.6× the pace of the 21:00 UTC trough.
- Venue rankings by raw volume are fragile, including ours. Trade-size profiles differ by two orders of magnitude between exchanges with similar totals, so the price index anchors on the cross-venue median rather than on volume.
Every price you see for bitcoin is the outcome of trades somewhere. This piece is about the _somewhere_: which markets, which currencies, which hours. All figures are from Coinmico's own trade feed, which records every print from the 51 exchanges we connect to and converts it to dollars at the FX rate of the minute it happened. Nothing here is self-reported by an exchange.
 BitcoinBTCAcross 50 spot markets we index
Spot is still the bigger market, barely
Over the seven days to 23 September we recorded $130.0B of bitcoin spot volume. Derivatives on the same coin added $76.6B in USDT- and USDC-margined perpetual swaps, $4.5B in coin-margined inverse contracts and $0.2B in dated futures.
| Contract | 7-day volume | Share |
|---|---|---|
| Spot | $130.0B | 61.5% |
| Perpetual swaps | $76.6B | 36.2% |
| Inverse perpetuals | $4.5B | 2.1% |
| Dated futures | $0.2B | 0.1% |
The perpetual figure only covers the venues where we ingest perp trades (Binance, Bybit, OKX, Bitget, Gate, Hyperliquid and a handful of smaller ones), so it understates the true derivative share. Even so, spot remains the larger market for bitcoin on our count. That is not the case for most large altcoins, where perps routinely trade several times spot.
Tether is the unit of account
Split the spot figure by what bitcoin was bought _with_ and the picture is lopsided:
| Quote currency | 7-day volume | Share |
|---|---|---|
| USDT | $109.2B | 84.0% |
| USDC | $11.1B | 8.6% |
| USD | $8.2B | 6.3% |
| KRW | $0.93B | 0.7% |
| EUR | $0.46B | 0.4% |
| GBP, JPY, TRY, THB, others | <$0.1B | <0.1% |
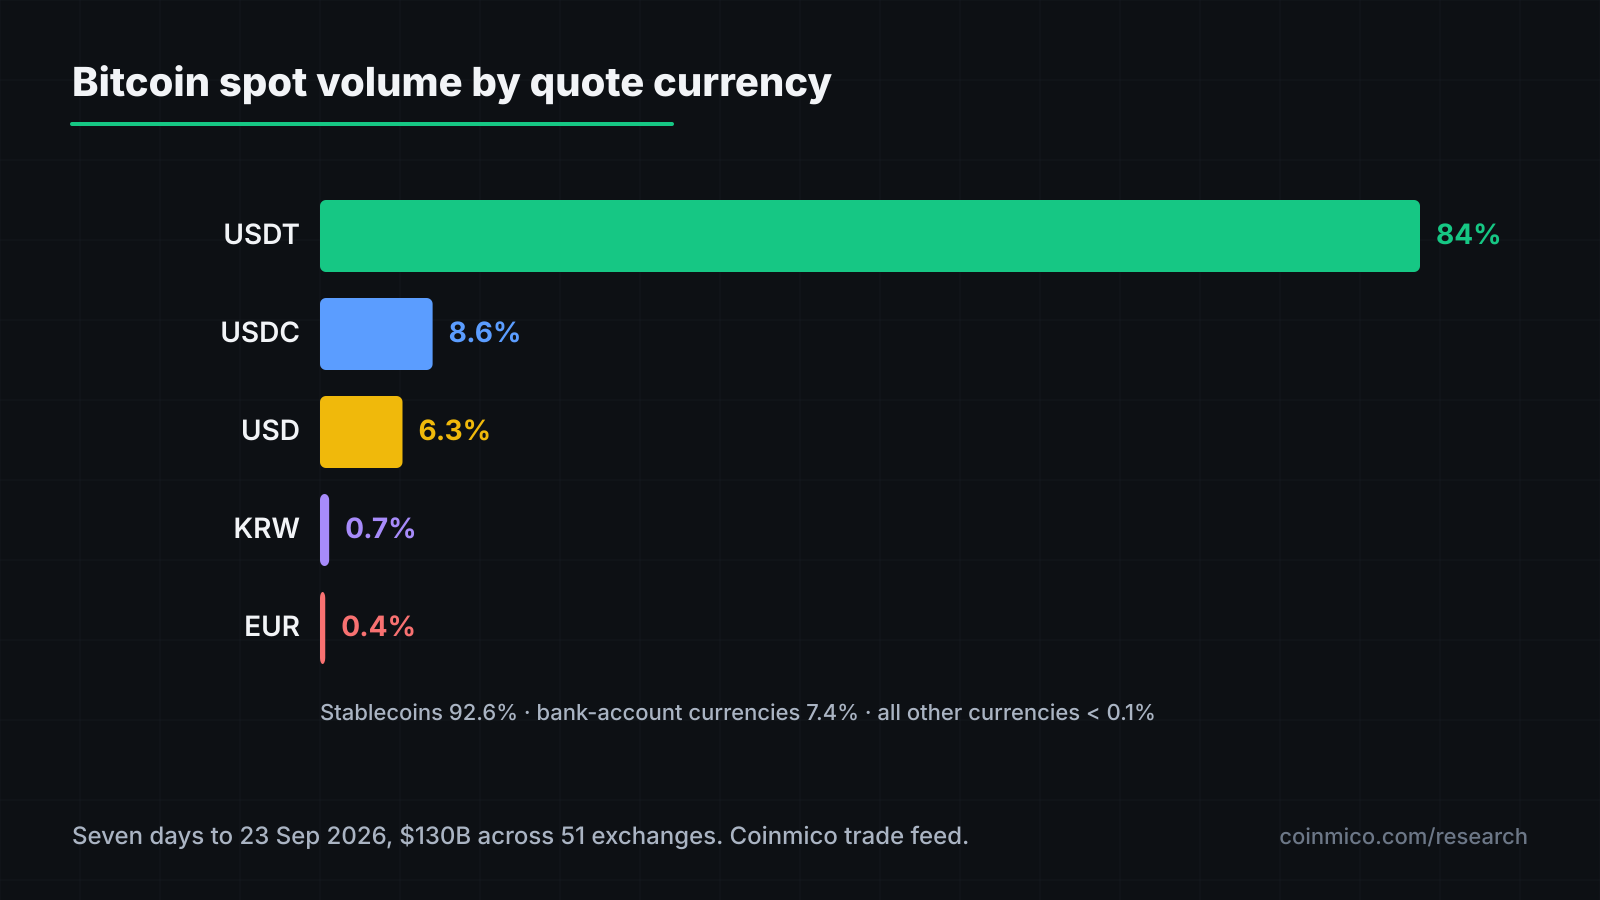
Two things stand out. First, stablecoins are 92.6% of bitcoin's spot market. Fiat pairs, the ones that touch a bank account, are 7.4% combined. Coinbase alone is roughly half of the fiat total.
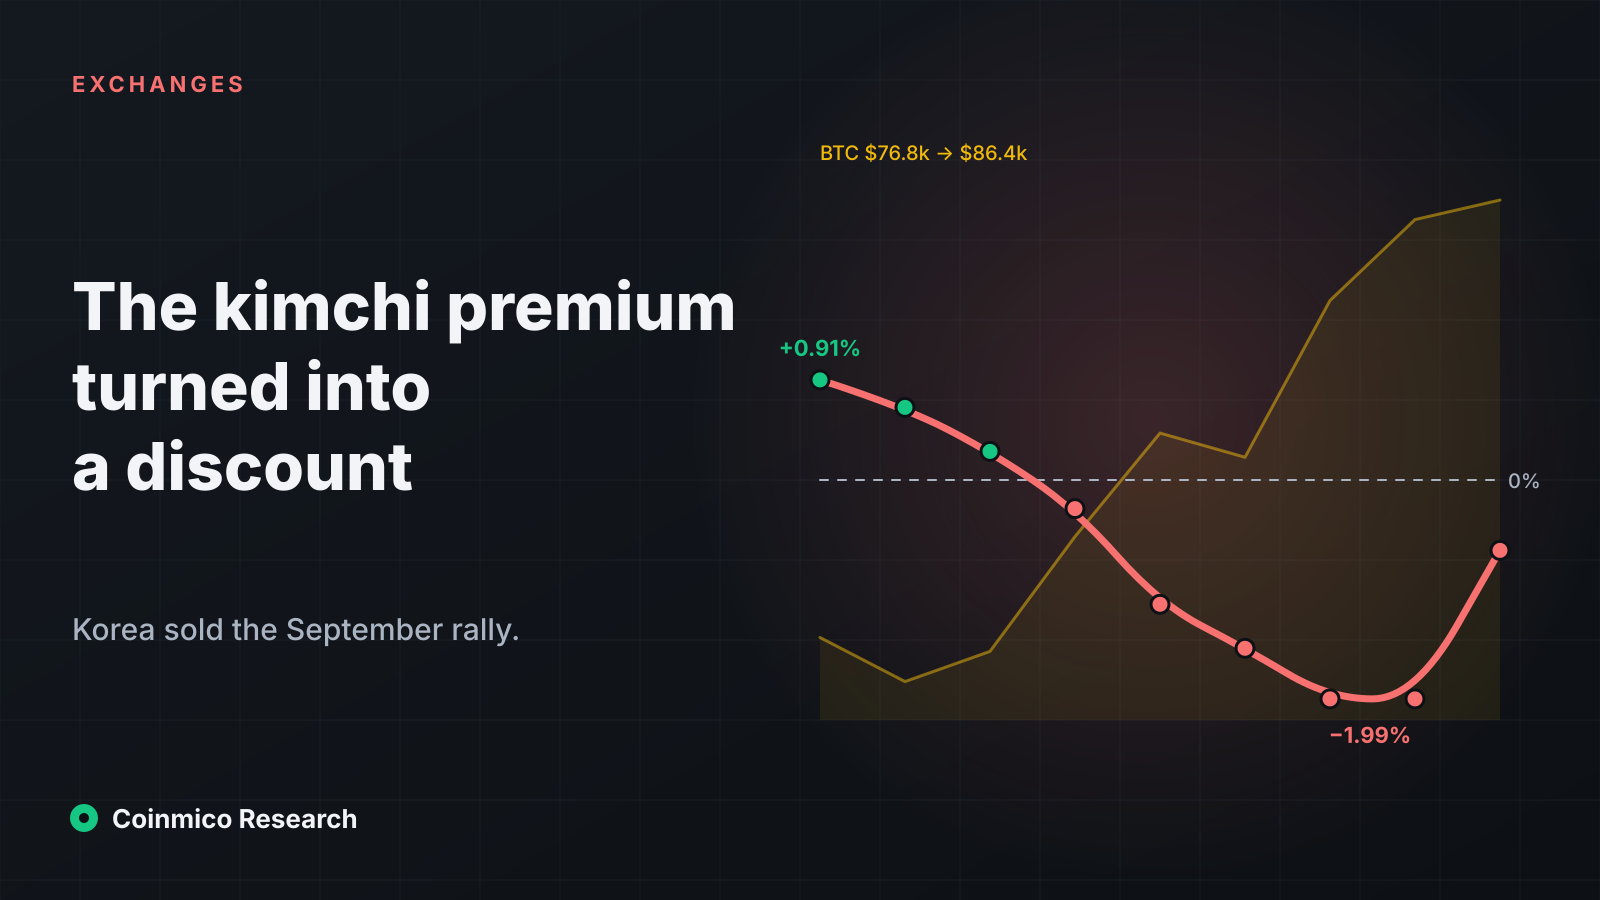
Second, the fiat that does trade is concentrated in three currencies. The Korean won is the third largest quote currency for bitcoin, ahead of the euro, with Upbit and Bithumb doing almost all of it. We look at the Korean market in more depth in The kimchi premium turned into a discount during the rally.
The newer regional venues we added this month — Indodax (IDR), Bitkub (THB), Coincheck and bitFlyer (JPY), Bitso (MXN) — are visible in the data but tiny for bitcoin specifically: a few million dollars a day each. Their value to the index is price discovery for coins that only trade locally, not bitcoin volume.
The three-hour peak
Bucket the last 30 days of bitcoin spot trades by hour of day, in UTC, and a sharp shape appears:
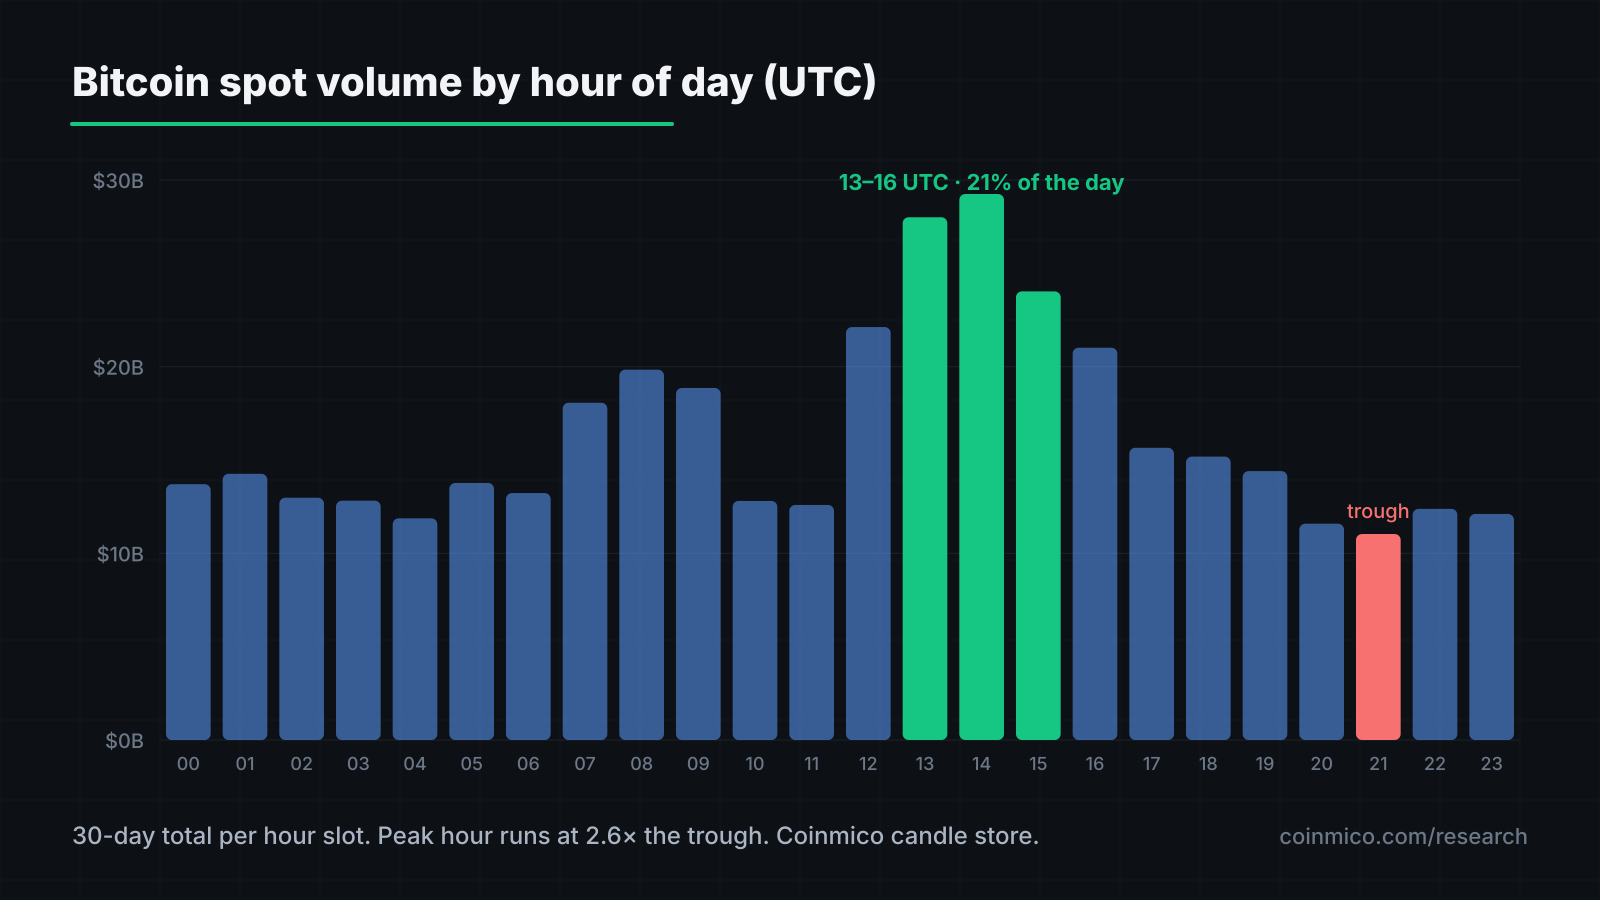
- 13:00–16:00 UTC is the peak: $24–29B per hour-slot over the month, topping out in the 14:00 hour. That is 09:00–12:00 in New York with London still open.
- 07:00–09:00 UTC, the European open, is a second, smaller hump at $18–20B.
- 20:00–21:00 UTC, after the US close and before Asia wakes, is the trough at about $11B.
The peak hour runs at 2.6× the pace of the trough. The three afternoon hours carry about 21% of the day's bitcoin volume, against the 12.5% they would carry if trading were spread evenly. For anyone placing large orders this matters more than the venue: the same size that is absorbed quietly at 14:00 UTC moves the price at 21:00.
The Asian session (00:00–03:00 UTC) is steady rather than spiky at $13–14B per slot — slightly above the overnight trough, well below Europe.
Venues: why the ranking needs a second column
You may be expecting a league table of exchanges here. We have one — the exchanges page ranks venues by the volume we measure — but we are not going to reproduce it for bitcoin without a caveat, and the caveat is in the trade data itself.
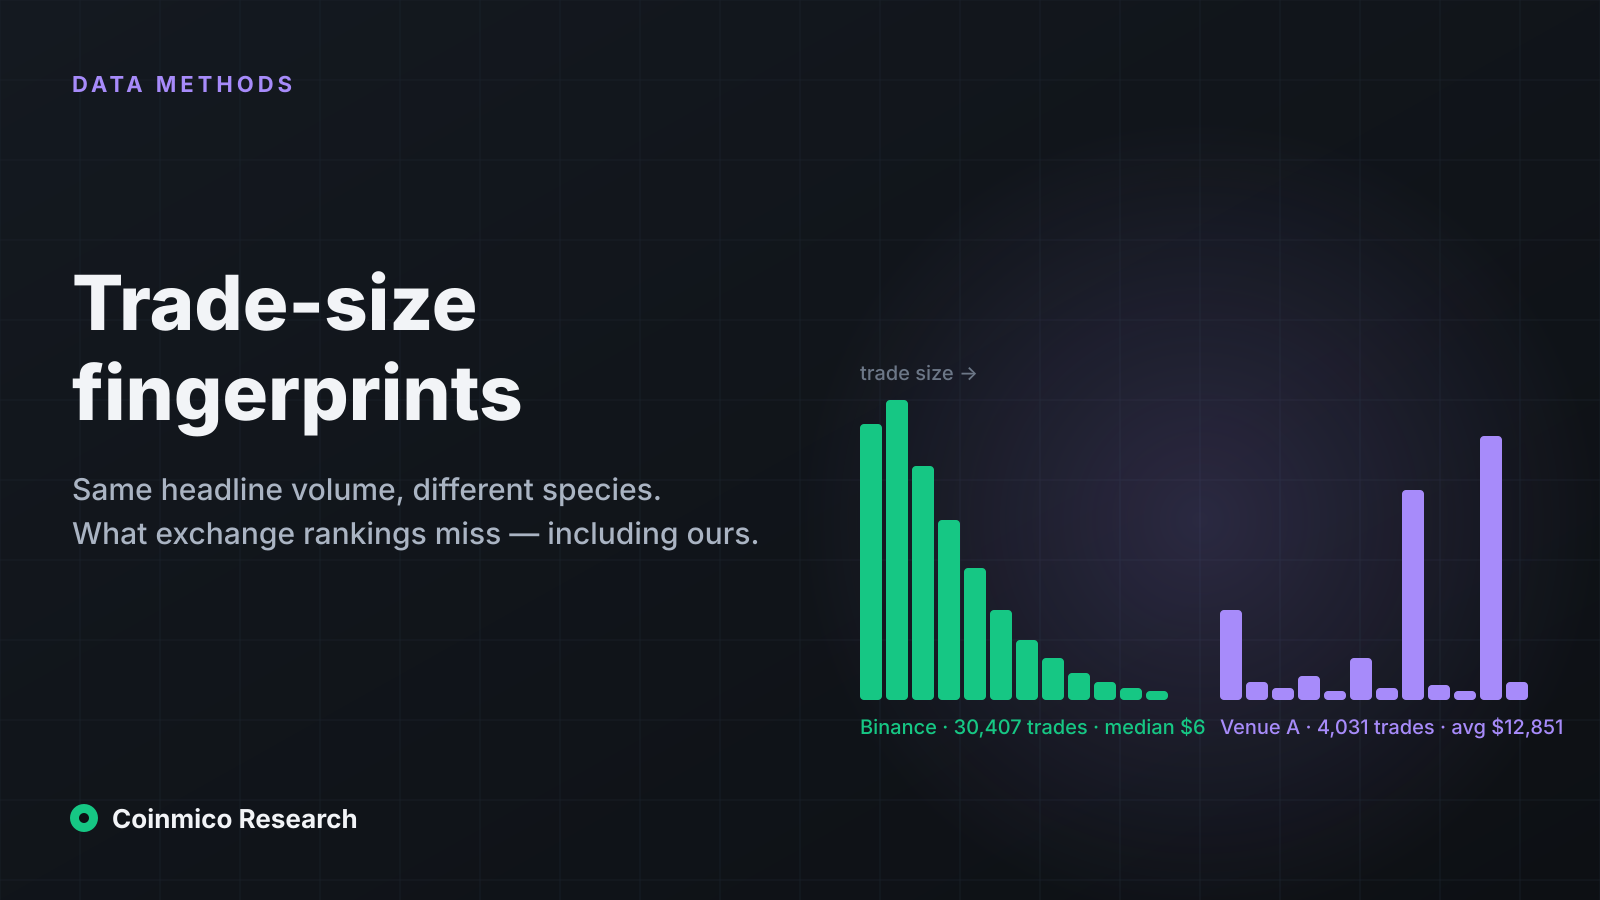
In a six-hour window on 23 September, Binance printed 30,407 bitcoin spot trades with an average size of $674. Coinbase and OKX show a similar profile: a median trade of a few dollars, a 90th percentile around $1,000–3,400. That is what a market with thousands of retail and algorithmic participants looks like.
Several venues that rank above Binance on raw seven-day volume show a different shape: a few thousand trades with average sizes of $6,000 to $40,000, and 90th-percentile prints of $10,000 to $97,000. The dollar totals are large; the number of distinct-looking participants is small.
We cannot tell from prints alone whether that is market-making bots, internalised order flow or something else, and we make no accusation. What we can say is that a ranking which puts those venues above Binance — as ours currently does on raw measured volume — does not describe where bitcoin's _price_ is formed. The price index guards against this by anchoring on the cross-venue median before any volume weighting; the exchange ranking does not yet, and adding trade counts and a size profile to it is on our list. We go through the data in Trade-size fingerprints.
| Coin | Price | 24h | 24h volume | Market cap |
|---|---|---|---|---|
| BitcoinBTC | $84,064.54 | 2.82% | $21.00B | $1.69T |
 EthereumETH EthereumETH | $2,662.88 | 3.13% | $9.38B | $325.1B |
 USDCUSDC USDCUSDC | $0.9999 | 0.01% | $5.60B | $75.13B |
 XRPXRP XRPXRP | $1.50 | 4.66% | $3.91B | $94.23B |
 SolanaSOL SolanaSOL | $114.25 | 3.00% | $2.63B | $67.13B |
 ZcashZEC ZcashZEC | $1,524.98 | 1.95% | $1.81B | $25.84B |
 NEAR ProtocolNEAR NEAR ProtocolNEAR | $4.34 | 2.09% | $1.48B | $5.68B |
 TetherUSDT TetherUSDT | $0.9999 | 0.01% | $1.19B | $183.4B |
What this means
- Bitcoin's spot market is, in practice, a USDT market. Anyone modelling flows, liquidity or contagion should treat Tether's health as a first-order risk to bitcoin liquidity, not a side issue.
- Fiat on-ramps are a small door. Seven cents of every spot dollar touches a bank-account currency. The often-quoted idea that "institutions buy on Coinbase" is consistent with the data — Coinbase is the largest fiat venue — but the volume is an order of magnitude below USDT venues.
- Time of day is a liquidity variable. For execution, the 13:00–15:00 UTC window offers more than twice the depth of the late US evening.
- Raw volume is not a quality metric. Use it with the trade count and the price-agreement data we publish alongside it.
BitcoinBTCPrice, last 30 days+6.60%_Method note._ Volume is the sum of price × size for every trade we received, converted to USD at the FX rate at the time of the trade. Markets flagged as price outliers or tokenised equities are excluded. Perpetual and futures volume is notional. The 30-day hour-of-day series uses hourly aggregates from our own candle store; the venue trade-size figures use raw ticks, which we keep for a rolling window.
Assets in this piece
 Bitcoin
 Tether
 USDC
USDCSources
- Coinmico trade index, 51 centralised exchanges, spot and derivative markets
- Coinmico venue volume pages
Everything else in this piece is measured by Coinmico across the venues and chains we index. See our methodology.