

Methodology
Every figure on this site, and the arithmetic behind it.
Coinmico measures the market itself: exchange trade streams and on-chain swaps are folded into our own reference price, volume, capitalisation, candles, derivatives and rankings. This page documents the sources, the rules, the exclusions and the limits — in enough detail to disagree with.
- Last updated
- 29 August 2026
- Applies to
- Every price, volume and ranking published on coinmico.com
Step 1
Collect
Trade streams from the exchanges we connect to, and swap events decoded from the pools we index, arrive continuously and are stored with their own timestamps.
Step 2
Vet
Each market is re-measured against its asset's other markets. Outliers, tokenised equities and mistaken token identities are excluded, with the reason recorded.
Step 3
Settle
Venue windows are volume-weighted, the cross-venue median removes the outliers that remain, and the index settles every two seconds with a venue count and a confidence.
Step 4
Publish
Candles, capitalisation, rankings, sentiment and the API all read that one store, which is why the same number appears everywhere on the site.
What we are measuring right now
The rules below are applied to this much market, counted the moment you loaded the page.
2,419
Assets in the catalogue
1,685 priced on our index in the last quarter hour
25,720
Markets indexed
Spot, perpetual and dated contracts, each in its own bucket
88
Trading venues
51 exchanges and 37 on-chain protocols
21
Blockchains read
3,797,831 pools discovered
4.16M
Swaps decoded (24h)
Pool events we read ourselves, not a venue's report
612
Assets with perpetuals
Funding and open interest sampled on 7 venues
Dec 26, 2024
Daily history from
The oldest close our own store holds
1,927
Headlines stored
From 5 publishers, linked to the assets they name
Coverage moves as venues list and delist and as our indexers reach new pools, so these numbers change between visits. A figure the database cannot answer is left as an em dash rather than carried over from the last time it could.
Section 1
Principles
Coinmico publishes its own market data. Prices, volume, capitalisation, candles and rankings are computed from trades we collect directly from exchange streams and on-chain pools — not requested from another aggregator when you open a page. Three rules govern everything below.
- Measured, not reported. A venue's own volume figure is never displayed as ours; what we show is the traded value we observed on that venue.
- Labelled where it is not ours. Where a figure comes from an ingested source or an emergency fallback, the page says so instead of presenting it as our measurement.
- Silent where we cannot measure. A window our history does not cover, or a metric a node cannot answer, is left empty rather than approximated into something that reads authoritative.
Section 2
What we read
| Source | What we take from it |
|---|---|
| Spot exchange streams | Live trade tapes from the centralised venues we connect to — Binance, Coinbase, Kraken, OKX, Bybit, KuCoin, Gate.io, Bitget, MEXC, HTX, Upbit, Bithumb, Bitfinex, Bitstamp, Crypto.com, WhiteBIT, Gemini, Bullish, BingX, BitMart and the rest of the list on the exchanges page. Every trade is timestamped and stored by us. |
| Perpetual and futures tapes | The contract side of the same venues plus Hyperliquid, kept in separate buckets from spot because a perpetual trades at a funding-driven premium or discount. |
| On-chain pools | Swap events decoded straight from the pool contracts — Uniswap v2/v3/v4, PancakeSwap v2/v3 and Infinity, Aerodrome and Slipstream, SushiSwap and other Solidly deployments on the EVM chains we index, plus Raydium, Orca, Meteora and PumpSwap read over Solana JSON-RPC. |
| Order books | Top-of-book quotes for every market a venue lists, and rotating depth samples on the deepest markets, behind the spread, depth and liquidity figures. |
| Token contracts | ERC-20 total supply and burn-address balances read over JSON-RPC on the chains we run a client for, so a burn shows up without waiting for a third party to notice it. |
| Reference rates | Fiat quotes from an independent FX feed, refreshed every ten minutes. BTC and ETH cross-rates come from our own index. |
| Ingested metadata | Descriptions, links, contract addresses, sector tags, reported supply and logos are ingested from public sources and stored on our side. This is also the emergency fallback if our own pipeline is interrupted, in which case the affected view is labelled as fallback data. |
| Holder distribution | Read from public Blockscout instances and labelled as such, because replaying every token transfer is beyond the public gateways we run on. |
| Long-tail quotes | Curated assets our venues and pools do not reach yet are quoted from DEX Screener (or GeckoTerminal when it has no answer) for the token's contract, stored under that source, and never mixed into our index. |
Section 3
Coverage
The ingester tracks the largest assets by capitalisation — a universe of about two thousand, re-resolved every six hours — together with every pool our on-chain indexers watch: up to 1,500 pools per EVM chain and several hundred on Solana, deepest first, with newly discovered pools folded in as discovery reaches them.
Assets outside that universe are listed from stored metadata until liquidity brings them into range. Venue and pool rankings on the exchange pages are computed from the same tape as the coin pages, so the numbers reconcile with each other.
Coverage is also the honest limit of this approach. We can only measure a venue we connect to, so our market-wide totals sit below aggregators that accept whatever a thousand exchanges report about themselves. We would rather publish a smaller number that traces back to observed trades.
Section 4
Reference price
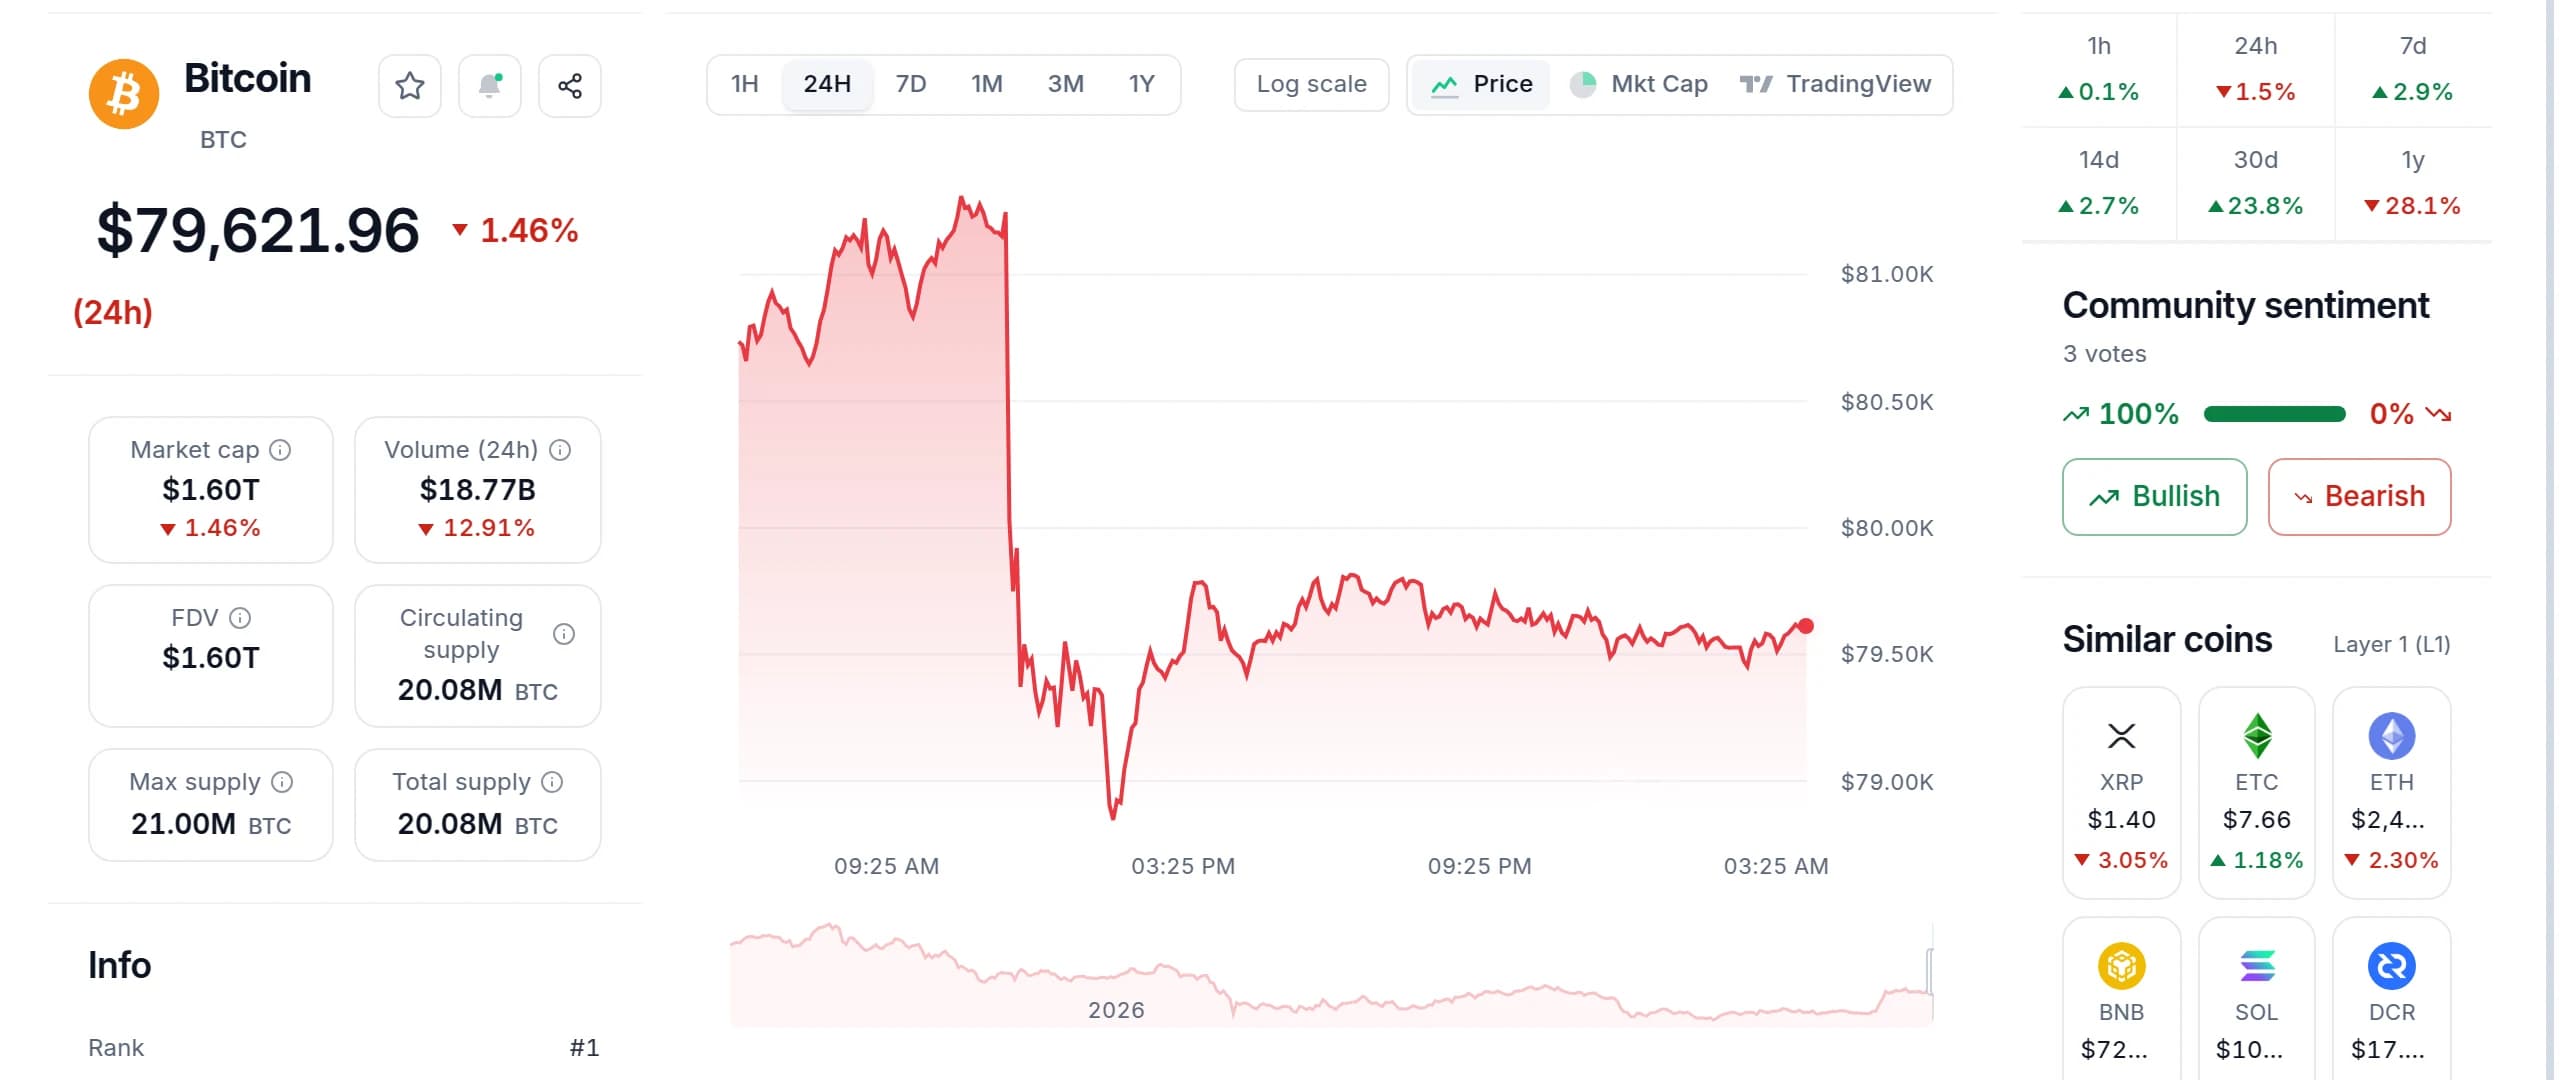
Every trade we receive is bucketed per venue over a rolling one-minute window, and the index settles every two seconds.
- Each venue contributes one volume-weighted average price for its window. Spot and perpetual on the same venue are separate buckets, and a perpetual carries a quarter of a spot market's weight.
- The cross-venue median is taken from the spot buckets, so a funding premium cannot drag the reference away from the cash market.
- Venues more than 2% away from that median are dropped as outliers; if that would leave nothing, the full set is kept.
- The surviving venues are weighted by traded notional, so the deepest markets dominate the settle.
- A settle that moves the price by more than 50% is held back unless the venues behind it are the ones that set the standing price, or outnumber them — the guard against a pair or pool mapped to the wrong token. After thirty minutes without a settle the standing price stops vetoing.
Each published price carries the number of venues behind it and a confidence value built from that count and the spread between the venues that agreed. A price with no fresh trades behind it for a minute is marked stale rather than shown as current.
An asset no exchange trades is settled from its pools instead, on the same arithmetic over a wider window: every pool that swapped in the last thirty minutes contributes the volume-weighted price of its own swaps, pools more than 8% from the cross-pool median are dropped, and what survives is weighted by traded value. It is published under its own source, requires at least three swaps and USD 500 of turnover in the window, and always yields to a venue price when one settles — so a long-tail token whose pools swap a few times an hour has a price of ours rather than none.
A listed asset that simply has not traded for ten minutes is priced from the middle of the books we read on its dollar-quoted markets: venues more than 5% from the cross-venue median are dropped, books quoted wider than 5% are ignored, and the result is published under its own source and labelled “order book” on the page. It carries no 24-hour volume, because a quote is not turnover, and it steps aside the moment a trade settles.
Section 5
Market integrity and exclusions
Every market we ingest is re-measured against its asset's own index price every ten minutes, over a seven-day window so that quiet venues stay under review long after they stop trading. Three tests apply.
| Test | What it removes |
|---|---|
| Outlier | A market whose last print sits more than 30% away from the level its asset's other markets agree on is excluded from candles, volume and extremes. Every leg is read in dollars first — books quoted in BTC or ETH are converted at our own index for those two, and a rate older than half an hour is refused rather than applied — so a gap that wide is a mapping error rather than a currency. |
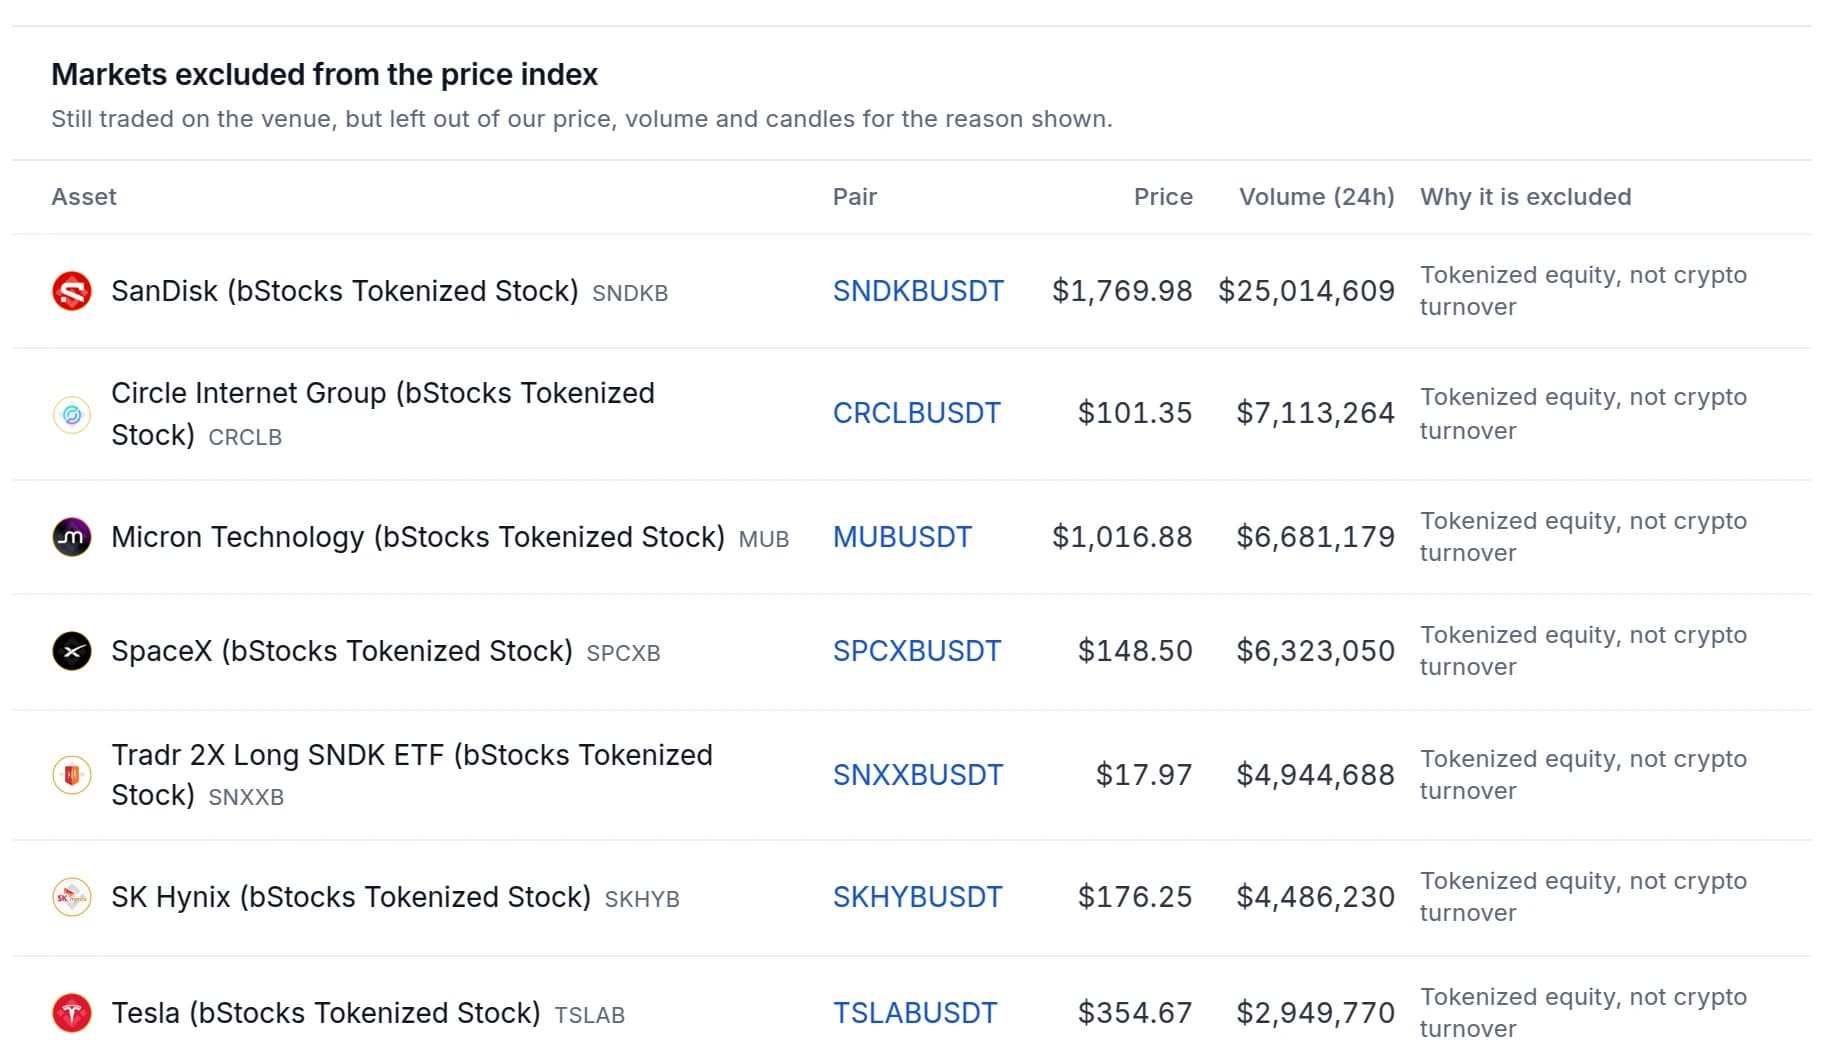
| Asset class | A market in a tokenised share, ETF or ETP is equity turnover rather than crypto turnover, so it is kept out of volume, rankings and the index. Tokenised gold, treasuries and credit stay in — those are assets traded in their own right, not a wrapper around a listed security. |
| Identity | A level more than six times above or below the asset's listing price is read as another token's price, not this asset's. Levels within a factor of two of the listing price are accepted as the asset's own before depth is considered, so a deep collision cannot outvote the level the listing recognises. |
Excluded markets are never deleted. They stay on the venue page with the reason recorded, so an exchange can see which pair we dropped and why, and a venue can be excluded from the index entirely while remaining listed.
Section 6
Volume
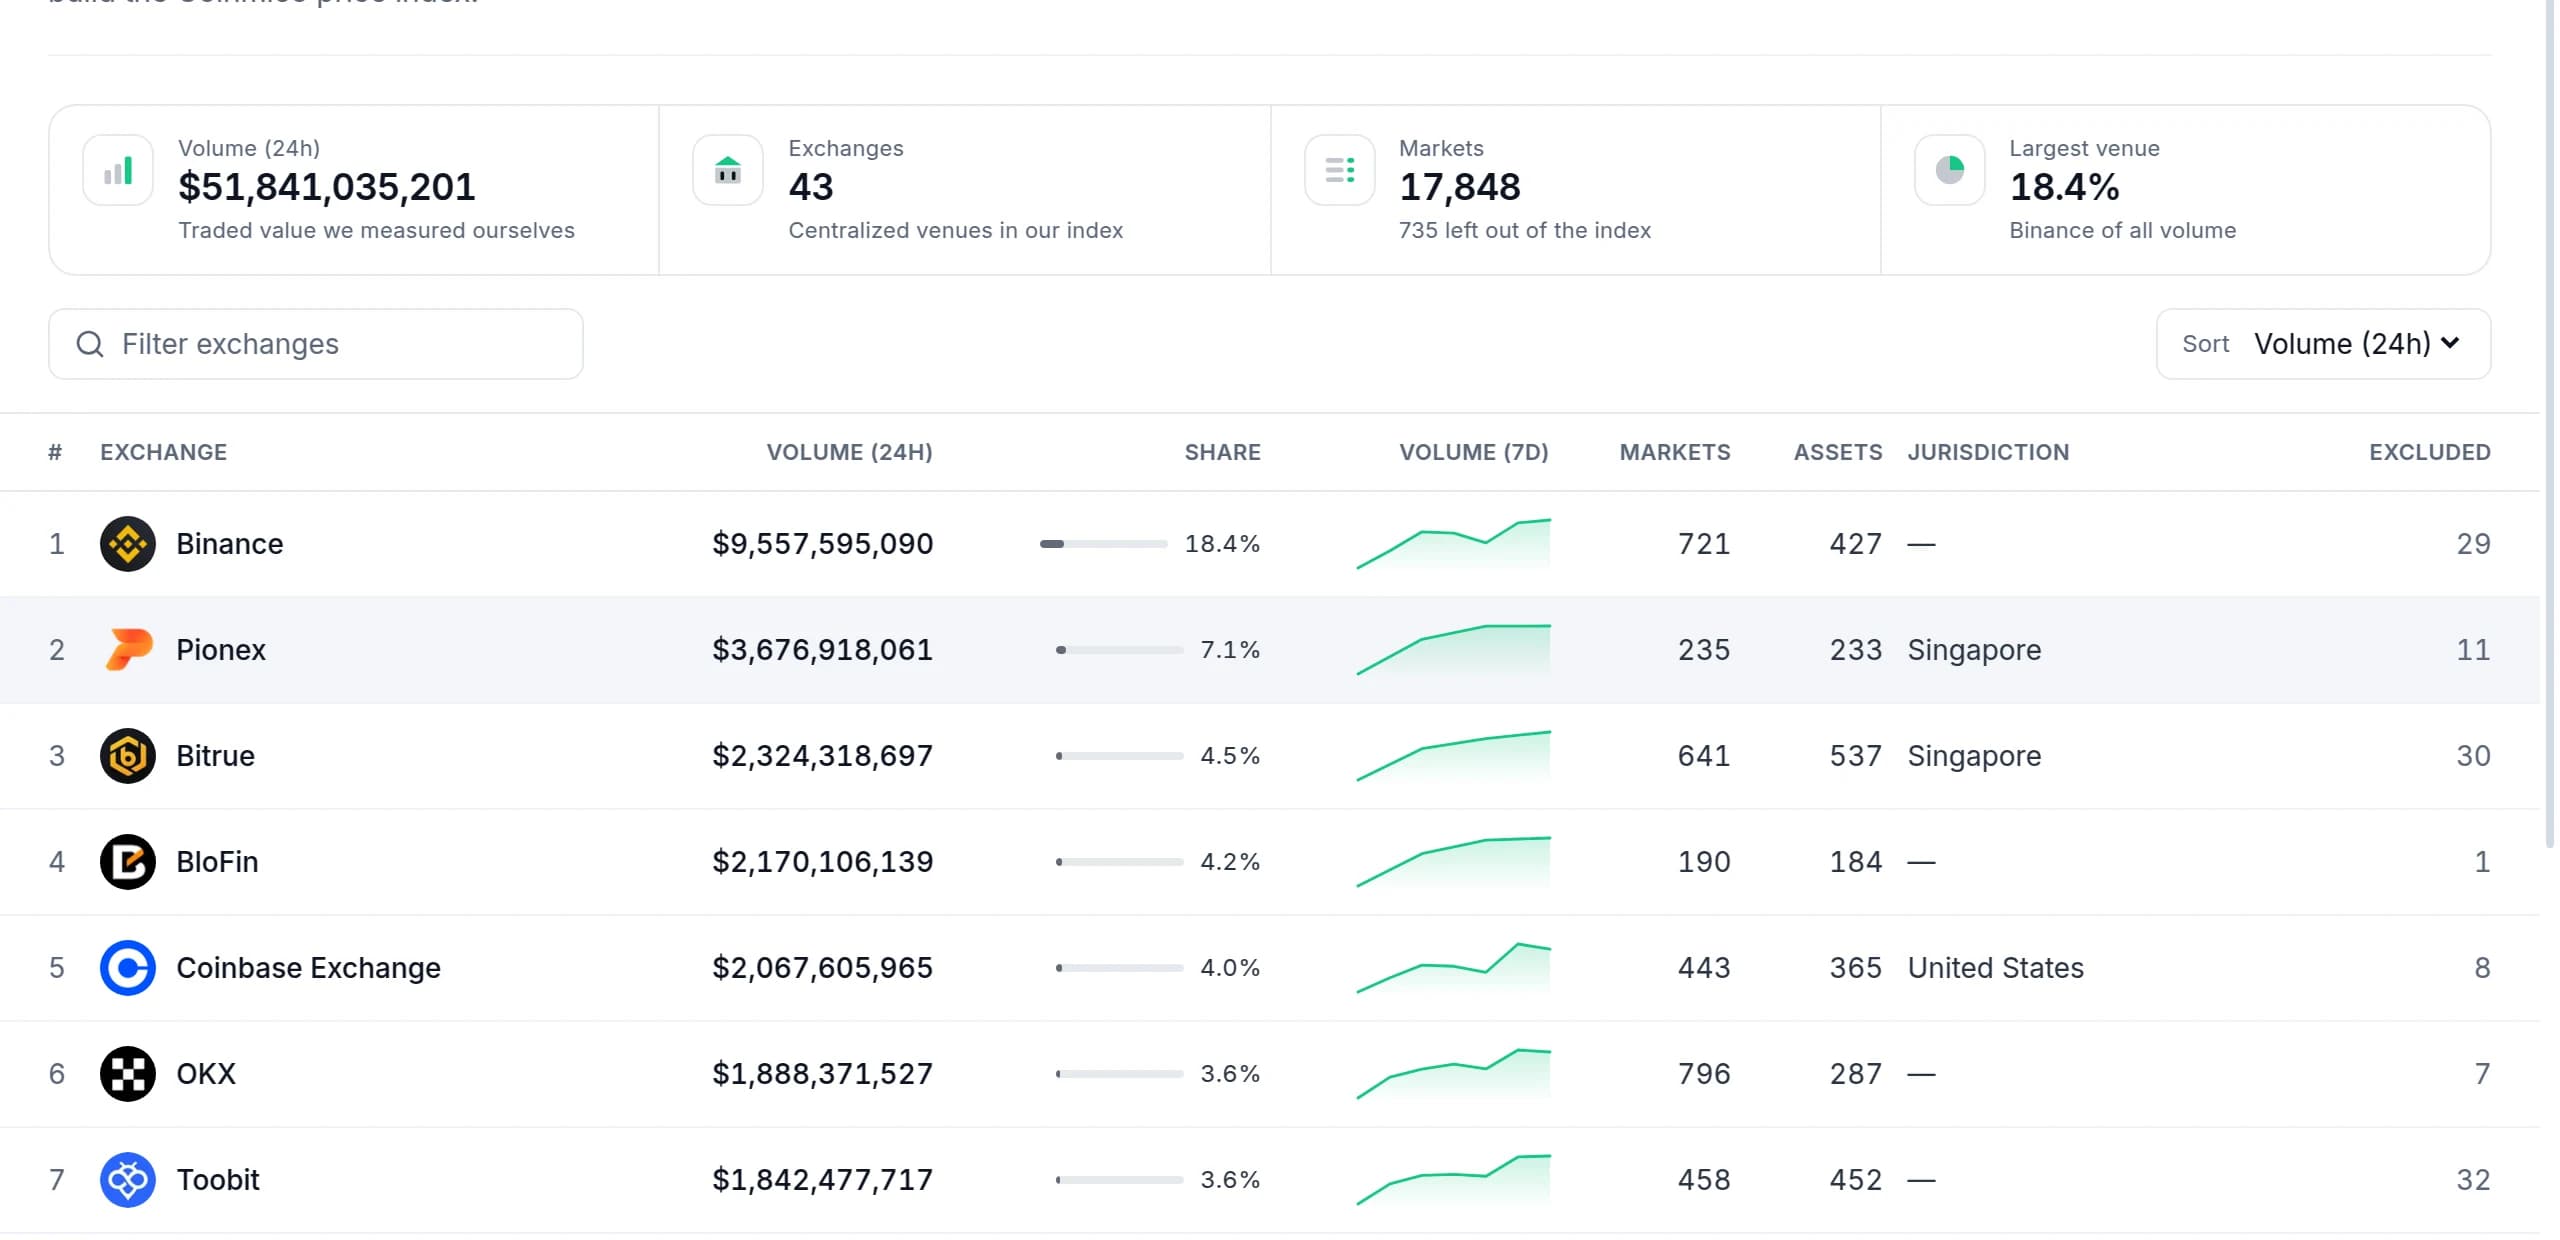
Volume is traded value we observed, not a figure a venue reports. Trades are folded into one-minute candles per market, and the 24-hour figure on a coin, venue or pool page is the sum of those candles over the trailing day, excluding markets the integrity checks removed.
A coin's 24-hour volume is spot turnover from both sides: the dollar-quoted books we stream on fee-charging venues plus the swaps our chain indexers decoded. Both are coin changing hands, so they are summed. Perpetuals and futures are never added to it — a contract can turn over many times a day without a coin moving — and they are reported on their own in the derivatives section.
Venues are ranked by the volume we measured on them, and each venue's share is computed against that same total, so a venue's rank and its share always agree. Pair and pool tables read hourly summaries that include the hour in progress, which is why a busy market's figure moves within the hour.
Section 7
On-chain measurement
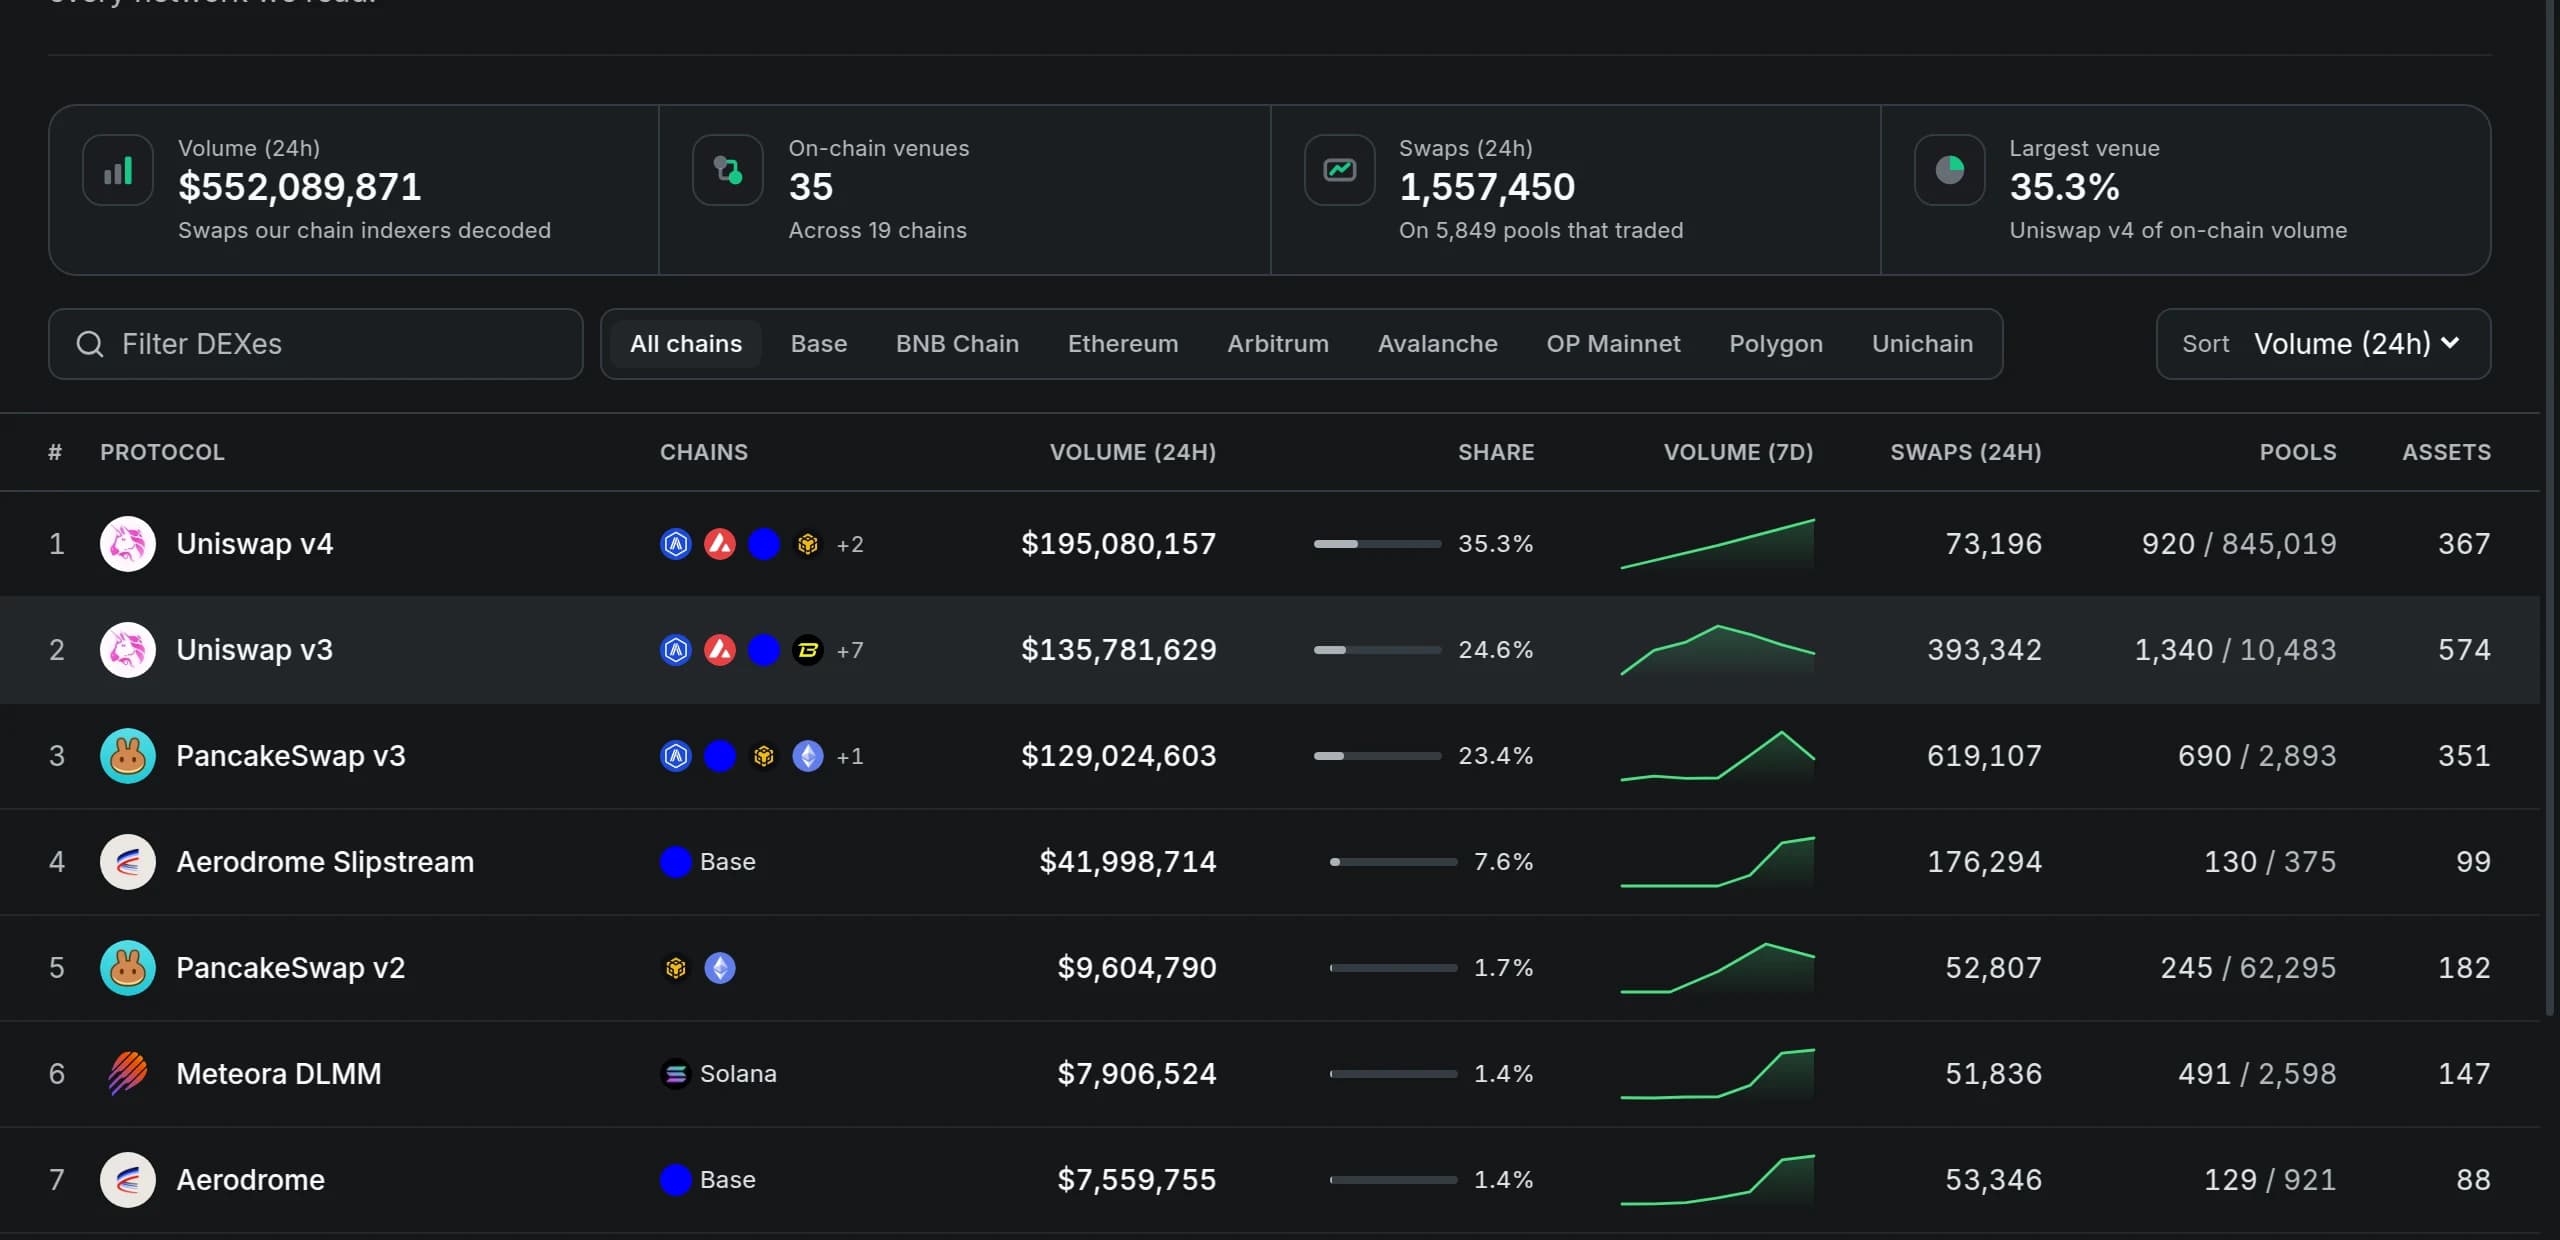
Our chain indexers read pool contracts directly and decode every swap event: the two legs, the amounts, the block and the pool it happened in. On-chain volume is the dollar value of the base leg of each swap, taken from the swap's own price — never a protocol's published total.
A swap whose implied price sits more than five times away from the index price of its base asset is left out of the roll-up, because a pool whose decimals we read wrong would otherwise dominate a venue's volume. Pool reserves are sampled alongside the swaps and are what the liquidity and depth columns show.
Section 8
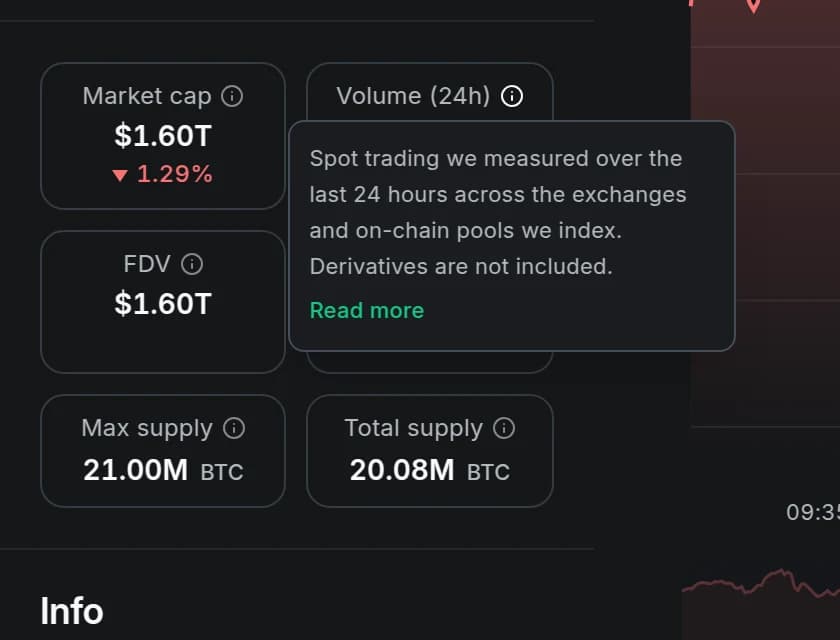
Market capitalisation, supply and FDV
Market capitalisation is our reference price multiplied by circulating supply. Fully diluted valuation uses maximum supply where an asset defines one, and is omitted where it does not.
Reported total, circulating and maximum supply are ingested and then curated on our side: allocations that are on-chain but not in the hands of the market — team, foundation, treasury, escrow and unvested grants — are subtracted before a figure is called circulating. Where a token contract lives on a chain we run a client for, total supply and the balances at the burn addresses are read from the contract itself.
Section 9
Candles, history and retention
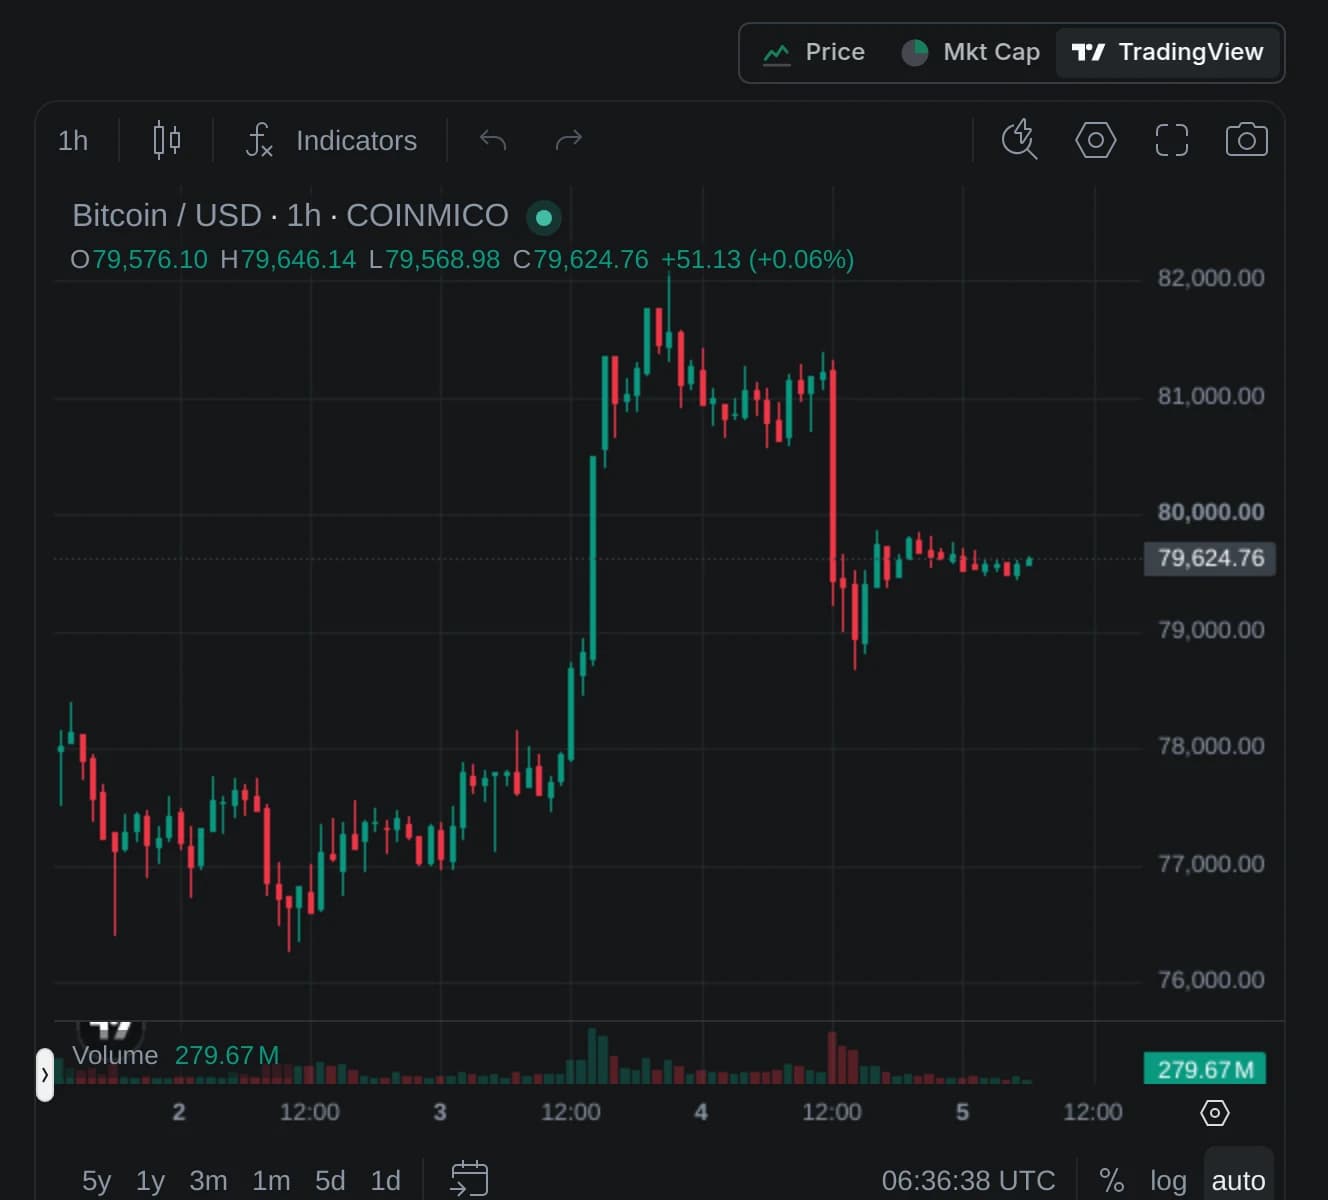
Raw trades are batched into the tick store, folded into one-minute candles, and rolled up from there into hourly and daily history. Each pass re-aggregates the last ten minutes of candles and the last three hours of history, so trades that arrived late or during a restart are still counted. Daily history further back than our own stream reaches is walked in from venue kline endpoints, deliberately slowly, and a chart interval our stored history does not cover is labelled rather than drawn.
The advanced chart on a coin page is TradingView's charting library reading our candles through our own datafeed — the drawing tools and indicators are theirs, every bar in them is ours.
| Series | Kept for |
|---|---|
| Raw ticks | 20 minutes — they exist only to build candles |
| 1-minute candles | 14 days, compressed after the first day |
| Index snapshots (per minute) | 8 days |
| Hourly index history | About two years |
| Hourly venue and pool summaries | 90 days |
| Raw on-chain swaps | 7 days |
| Funding and open interest samples | 90 days |
Section 10
Price changes and extremes
The 1-hour, 24-hour and 7-day changes are measured against a sample our index actually holds near the reference point — within ten minutes, two hours and twelve hours respectively. Without that rule the first minutes after a cold start would compare against whatever the oldest stored row happened to be. The day and week windows also accept the hourly roll-up of the same index, so an asset the index skipped while it was quiet still carries a change rather than a dash.
Longer changes (14-day, 30-day, one-year) and the 7-day, 30-day and one-year highs and lows are published only once our stored history spans the window. Until then the field stays empty, or the coin page falls back to the ingested profile figure and says so. Each asset carries the date its measurement begins, so a reader can tell how far back our own record reaches.
Section 11
Derivatives
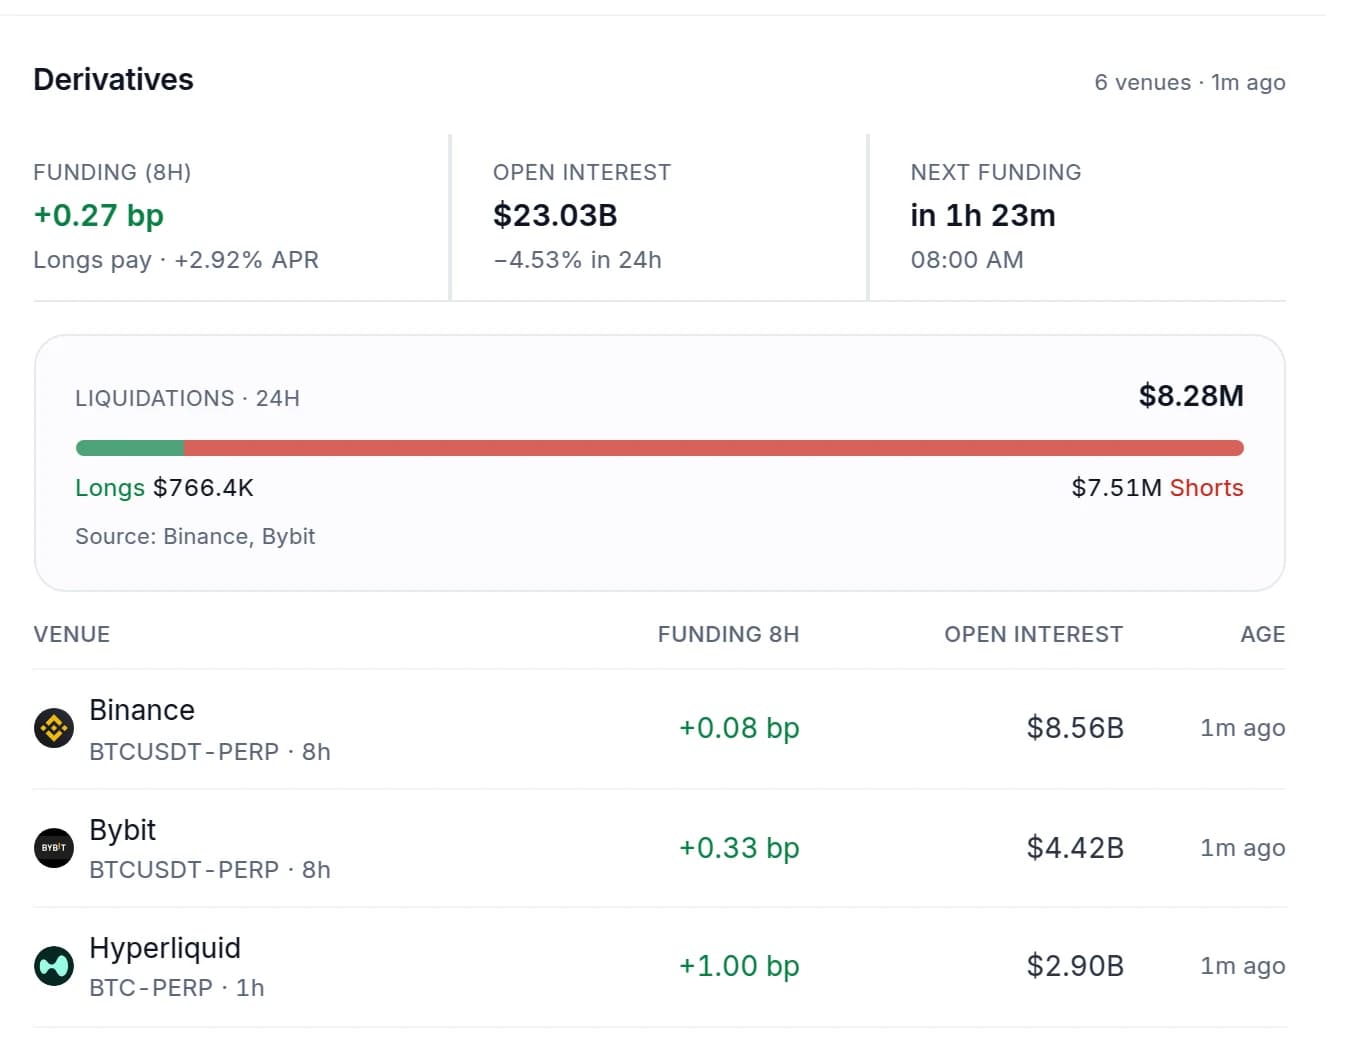
Funding rates, open interest and mark prices are read from the perp venues every five minutes and stored, so the panel has a history and a page load never waits on an exchange. Liquidations arrive on the venues' own sockets and are buffered into our store as they print.
- Funding and open interest are the venue's own published numbers. A venue that fails a pass contributes nothing rather than a carried-forward value, and a contract whose open interest we could not read keeps an empty column instead of an implied zero.
- A liquidation is stored as the position that was closed, not as the side of the order the venue sent: a long is closed by a forced sell. Reading the raw order side is the usual reason a liquidation chart comes out inverted.
- Derivatives turnover is never added to spot volume, and perpetual prices enter the index at a quarter of a spot market's weight, on their own bucket.
Section 12
Rankings, gainers and trending
Ranks are recomputed across the whole catalogue from our own capitalisation figures, so the number on a coin page is the number the listing uses. Gainers and losers sort the entire catalogue by measured 24-hour change rather than re-sorting the visible page, and the screener runs over the same rows.
Trending measures what the market is crowding into, from our tape rather than from a search box: turnover (24-hour volume against market capitalisation) contributes 55% of the score, the 24-hour move 30% and the 7-day move 15%. Each term is a percentile rank rather than a raw value, so one hyper-volatile micro cap cannot dominate the board, and only assets above about USD 10 million in capitalisation with measured volume are eligible.
Section 13
New coins
New coins lists assets our catalogue had never carried before, detected by an ingester pass rather than picked from the coins we already cover. Assets that were already in coverage when the detection date was introduced are dated from our own price history and are never treated as new. A detection is published only once every one of these is true of figures we measured ourselves.
- Detected inside the last 30 days, and observed trading for at least 24 hours before it is published, so a pair that appears and dies never reaches the page.
- Priced on our own index at the last settle, across at least two venues and above the engine's confidence floor. An asset carried only by an ingested or fallback quote is not eligible.
- At least USD 250,000 of 24-hour volume on the markets we measure, and a capitalisation of at least USD 1 million computed from supply we track.
- Trading on at least two venues or pools. A coin turning over USD 1 million or more in a day is admitted on a single venue instead: a listing normally opens on one venue and gains its second days later, and turnover at that size is not something a market nobody trades can show.
A token no venue trades yet takes the on-chain track of the same screen. Its price is the one we settle over the pools we index, and it is judged on measured swap turnover: at least USD 100,000 across two or more pools that traded in the last day, or USD 300,000 where only one pool exists, above the settle's confidence floor and held to the same 24-hour observation window. No capitalisation is required of it, because a token this young rarely has a settled supply — the column stays blank rather than being filled with an estimate. Those rows carry the chain the token was detected on instead.
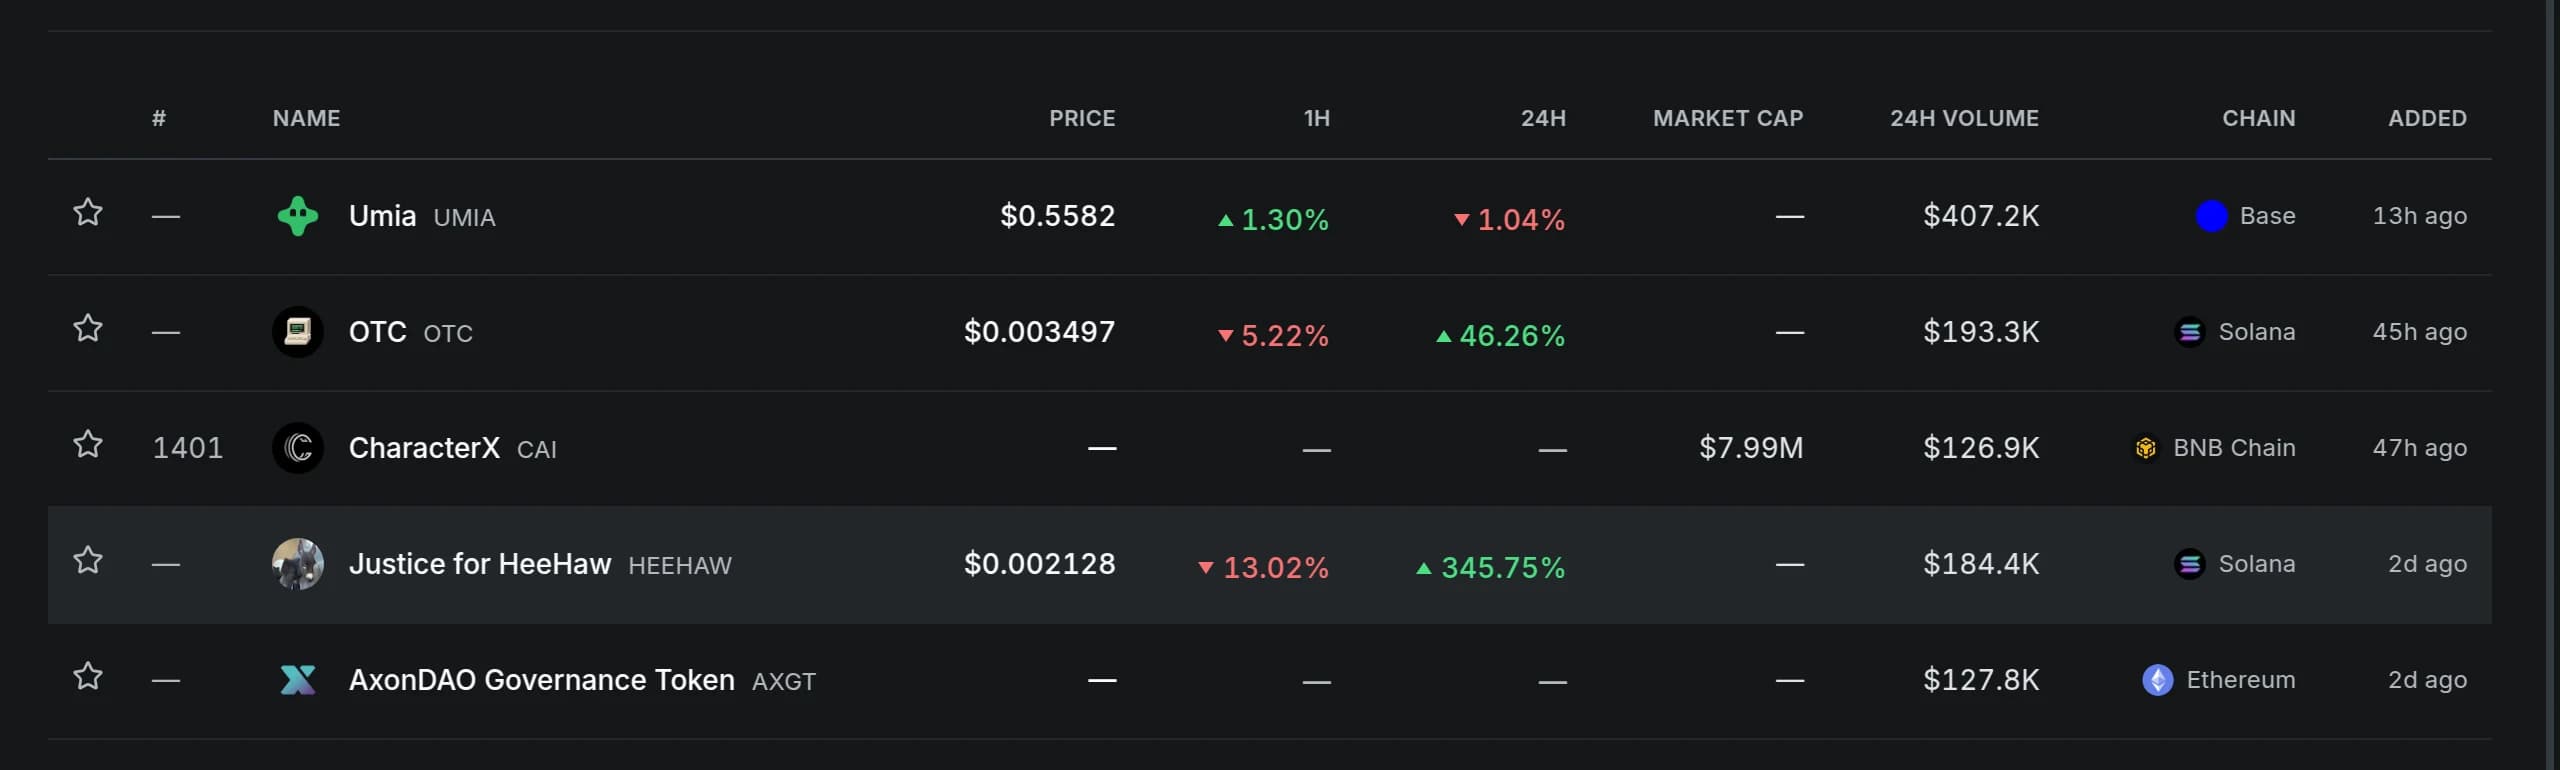
Qualifying assets are released into separate hourly slots, at most ten a day, with each slot fixed from the asset's own identifier so the page fills through the day and never reorders itself between requests. When no detection qualifies the page stays empty; nothing is rotated in to fill it. Screening is a data-quality filter, not a review of a project, its team or its contract. A listing request approved by our reviewers is published on that decision instead, and its price, volume and capitalisation stay blank until our own index measures a market for it. An approval is not an endorsement.
Section 14
Tokenised real world assets
A tokenised share, fund, metal or treasury bill is measured exactly like any other asset we carry: its price is settled on our own index over the markets we record, and its 24-hour turnover is summed from the trades on those markets. What changes is where the figures are published. Real world assets is that place, because tokenised equity is kept out of the crypto rankings, the venue volume and the crypto index under the asset-class test above — measured, but never counted as crypto turnover.
One column on that page is not ours. Beside the token price we show the last price of the listed instrument the token stands for, taken from Yahoo Finance: an external, unofficial feed, refreshed every fifteen minutes, carrying its own timestamp. It is published only where the instrument's own name agrees with the token's, so that an issuer suffix landing on a real but unrelated ticker cannot put the wrong company's price on the page; where nothing agrees, the column stays blank. Quotes in another currency are converted with the same rates the rest of the site uses, and a quote older than four days is dropped rather than shown.
Premium is the token measured against that price. It is arithmetic on two figures from different markets, not a trading signal: the listed market keeps hours and the token does not, so a premium widens by itself over a weekend and closes when the exchange opens. Tokenised gold, treasuries and credit are listed there too, though they carry no reference price — those are assets in their own right rather than a wrapper around a listed security, and they remain inside the crypto figures.
Section 15
Fear & Greed
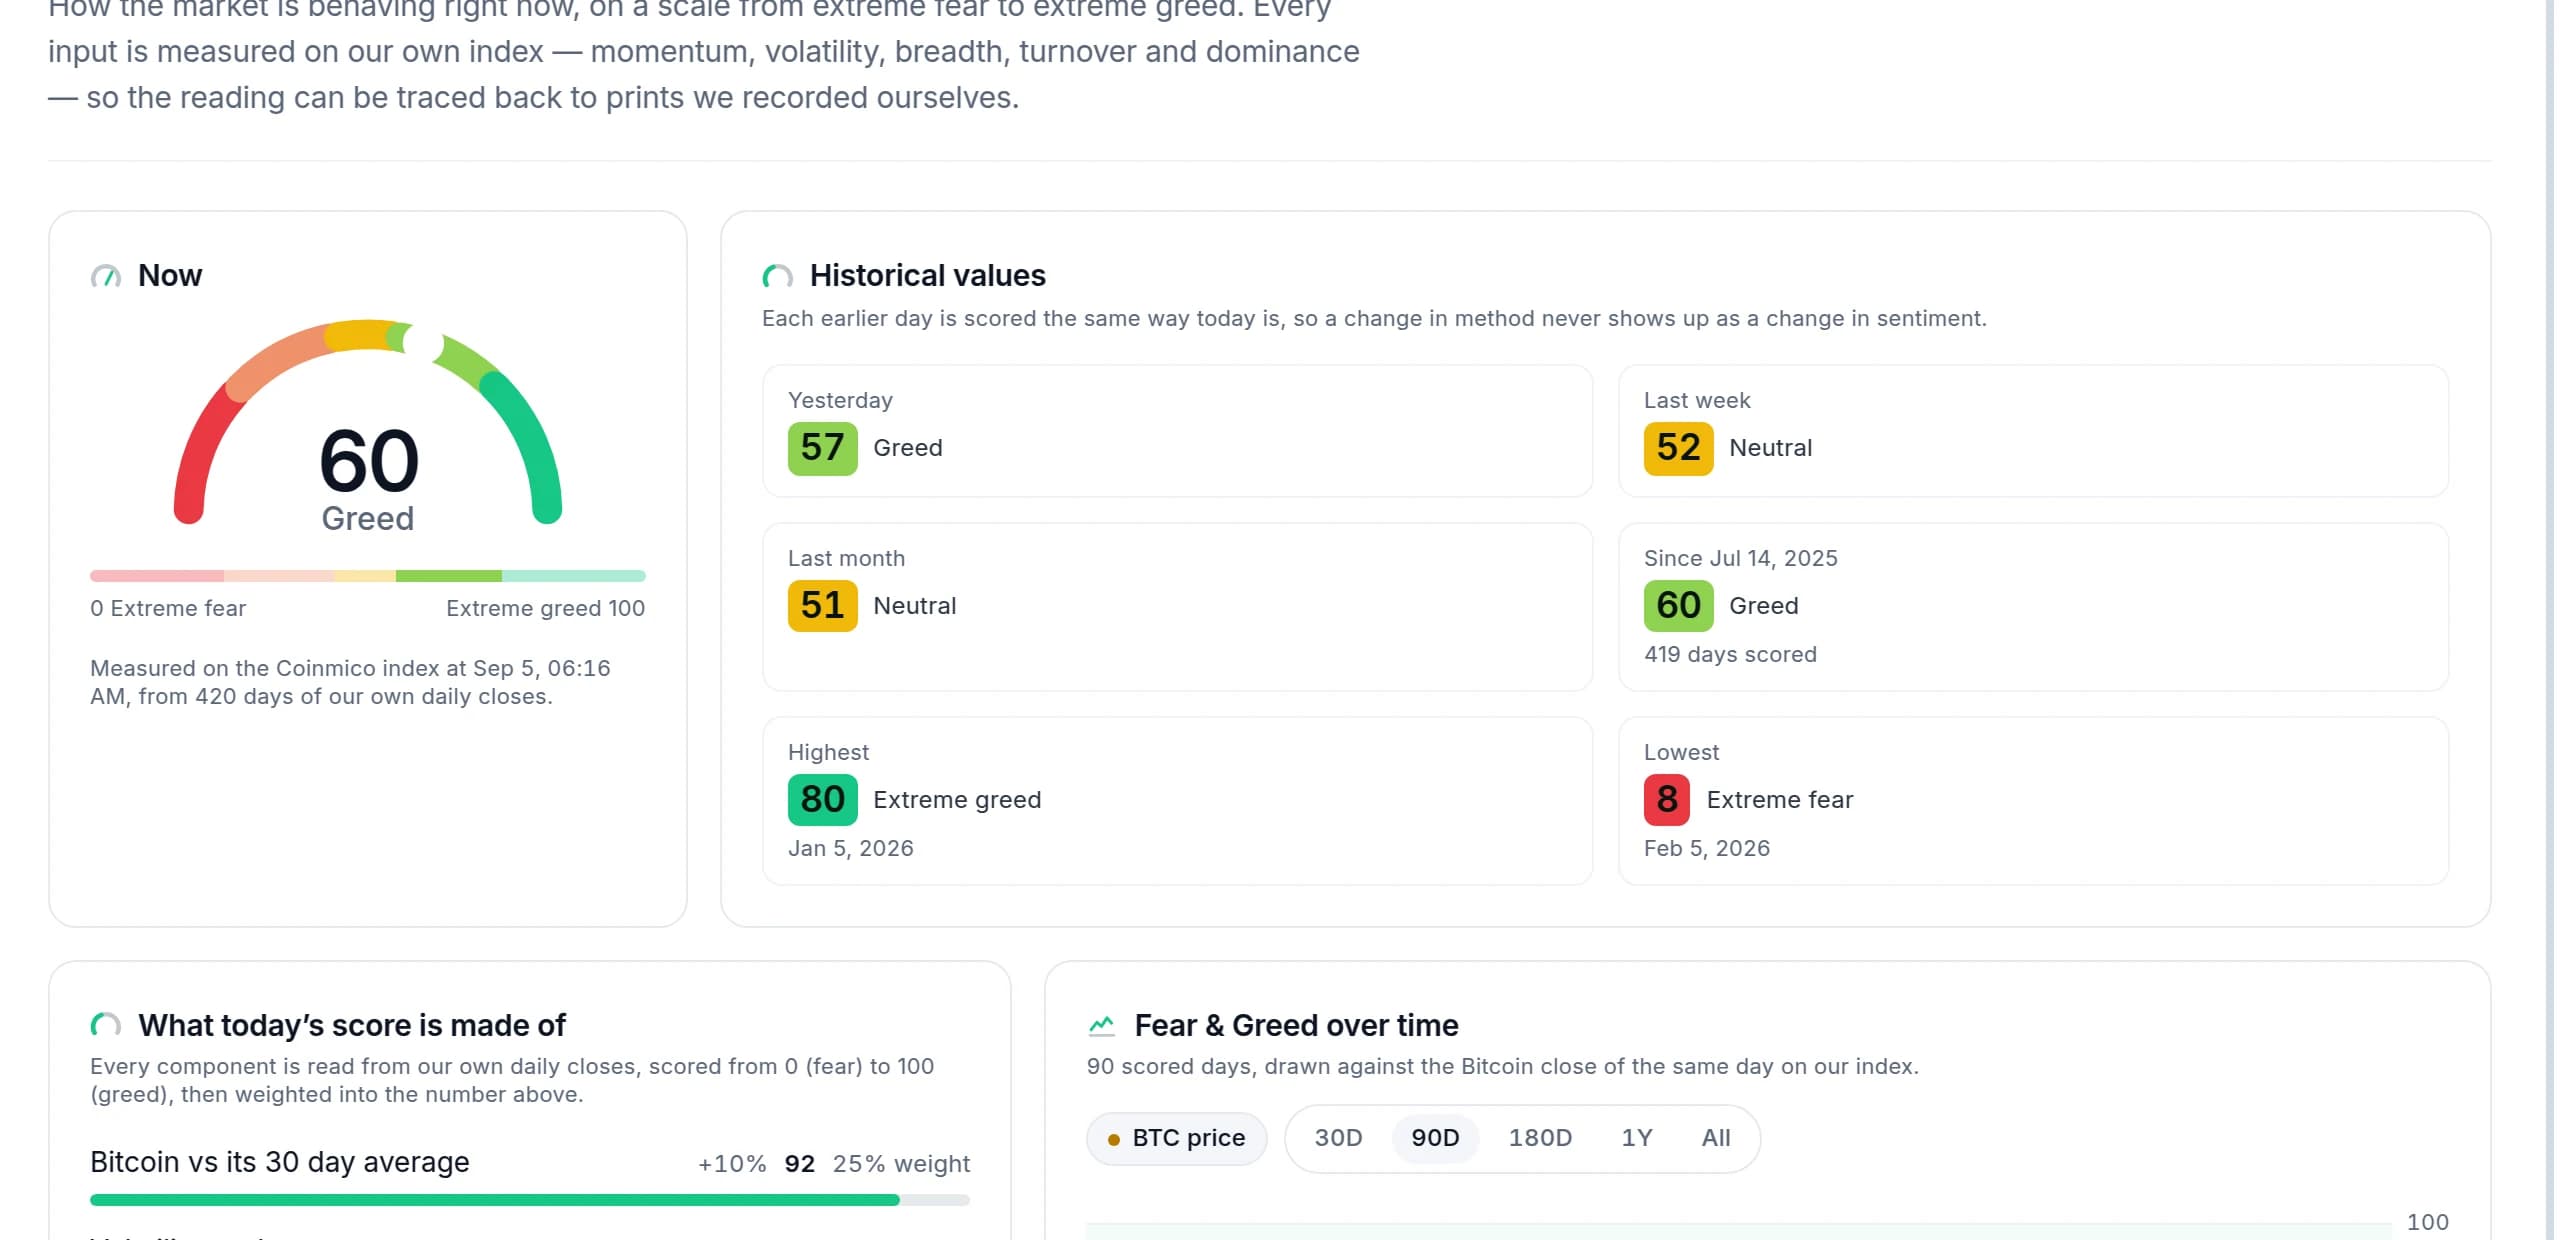
Our Fear & Greed reading is computed from the history we recorded ourselves — nothing is copied from another sentiment index — over a basket of the hundred deepest assets. Six components each land on a 0–100 scale before weighting.
| Component | Weight and meaning |
|---|---|
| Momentum | 25% — where price sits against its own month |
| Volatility | 20% — whether that move is calm or violent |
| Breadth | 20% — how many assets take part |
| Turnover | 15% — whether volume confirms the direction |
| Dominance | 10% — whether money is hiding in Bitcoin |
| Alt momentum | 10% — how hard the rest of the market is bid |
A component is published only once its baseline window is nearly full, and the yesterday and last-week readings are the same arithmetic re-run on those days rather than a stored score whose method may have changed since.
Section 16
Sectors, chains and global figures
Sector pages, chain pages, dominance and the global totals are aggregates over the assets we track: the newest index row where the engine has published one, and stored listing metadata where it has not. Sector membership comes from ingested tags, curated on our side; a coin can belong to several sectors, and each sector's capitalisation and volume are the sum over its members. The daily global series runs over a fixed basket, so a day on which the ingester reached fewer assets cannot read as the market losing value.
Section 17
News
We store the headline, the publisher's own summary and the canonical link — never the article body — and every click leaves for the publisher. A story is linked to an asset when it names it, which is what the most-mentioned list counts, and the prices shown beside a story are ours. News is editorial context around the data; it is not an input to any price, ranking or score on this site.
Section 18
Currencies
The index prices everything in dollars. Any other currency you select — fiat from an independent feed refreshed every ten minutes, or BTC and ETH derived from our own index — is that dollar figure converted at the stored rate, so switching currency never changes which trades a number came from. The converter and the calculator use the same rates.
Section 19
Watchlist, portfolio, alerts and wallets
- Watchlist and portfolio value your holdings with the same reference price the rest of the site uses; a position in an asset we cannot price is shown unpriced rather than valued at a guess.
- Alerts are evaluated on our servers every thirty seconds against the latest settle, not when you open the page, so a level crossed at four in the morning is still recorded and pushed. A one-shot alert disarms itself; a repeating one waits out a cooldown so a price sitting on the level does not fire on every pass.
- Wallet tracker reads balances from the chains themselves and values them with our prices. It never asks for a key, a signature or a connection.
Section 20
Limits and corrections
Automated measurement has failure modes, and we would rather name them than imply they do not exist: a venue stream can drop, a chain indexer can fall behind its head, a token's decimals can be read wrong, a newly listed pair can be thin enough that its own prints are noise, and an ingested supply figure can be out of date. The stale marker, the fallback label and the exclusions above exist for exactly these cases.
Figures are revised when late data arrives or an error is corrected, so a value read now may differ from the same value read later. Nothing on the site is investment advice — see the terms of service.
If a number looks wrong, tell us: send an asset or market correction through the listing form or write to [email protected]. Material changes to this methodology are published here with the date above.
Related: about Coinmico, terms of service and privacy policy.