Why USDT trades below one dollar
A dollar peg is a target, not a promise that every exchange trade prints at exactly $1. Redemption access, market demand, and trading costs shape USDT's price.
What You Will Learn
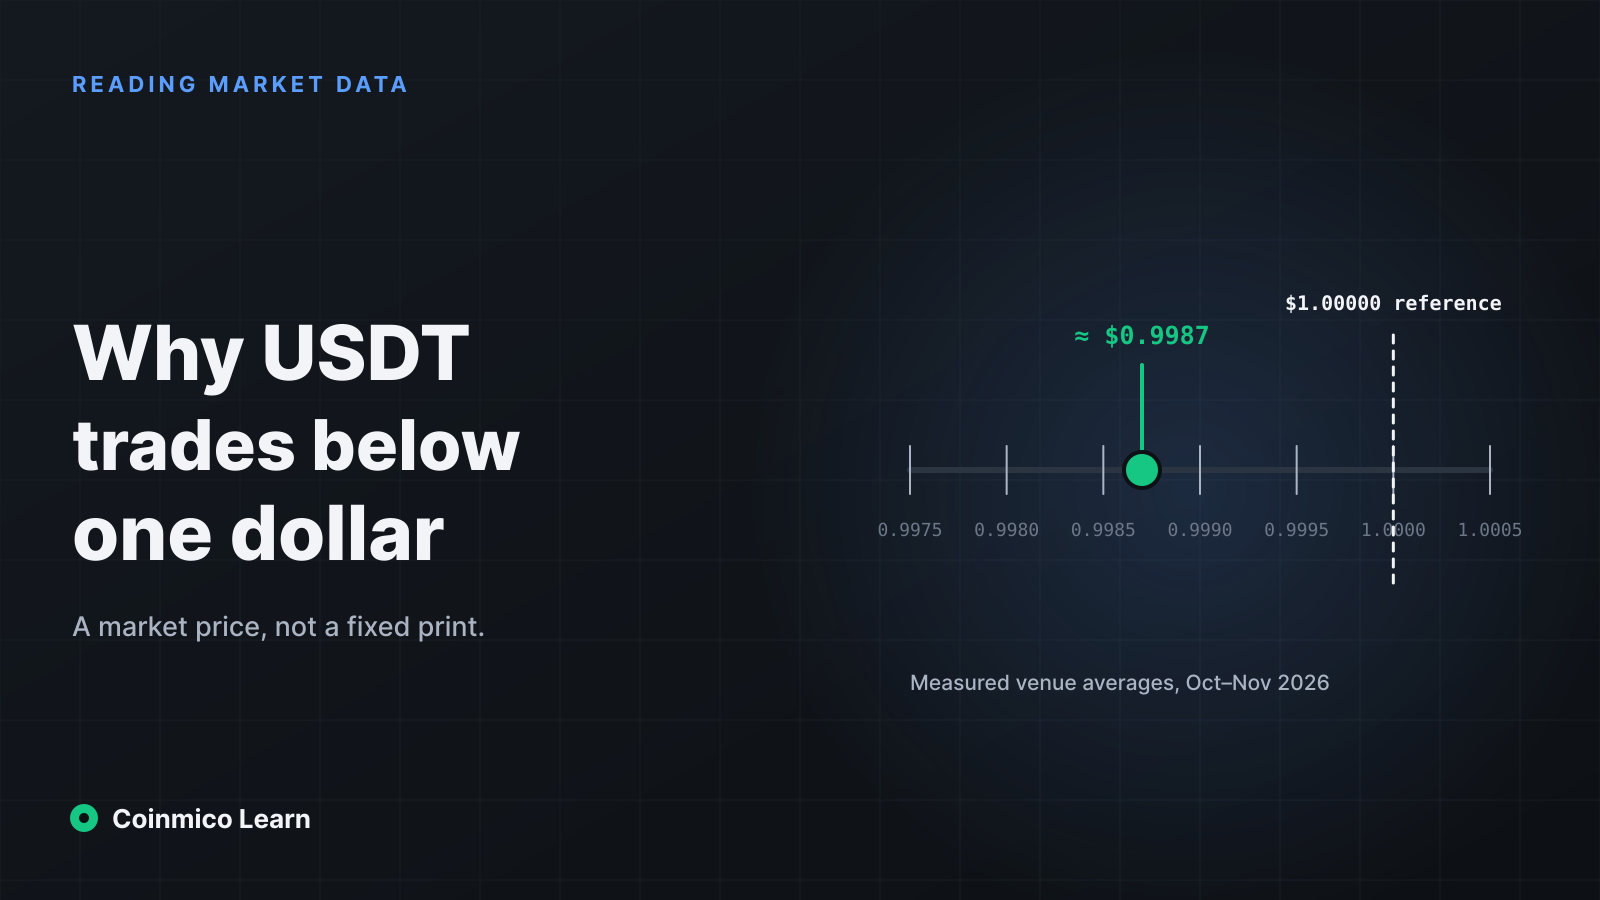
- "Coinmico measured USDT at roughly 13 basis points below $1 on most direct USD venues from 15 October to 7 November 2026."
- "Only eligible direct customers can redeem with the issuer, so most exchange traders depend on secondary-market liquidity and arbitrage."
- "Coinmico converts USDT-quoted assets using its measured USDT price instead of assuming every USDT is worth exactly one dollar."
USDT is designed to track the US dollar, but an exchange quote is a market price, not a guarantee of exactly $1. A small discount can appear when people want to sell USDT faster than buyers want to take it, or when the route to redeeming it is costly or unavailable to the trader.
Coinmico measured USDT/USD hourly closes across several venues from 15 October to 7 November 2026. During that window, USDT averaged about $0.9987–$0.9989 on most direct USD markets, roughly 13 basis points below one dollar. The measurement is a dated snapshot, not a claim that every stablecoin or every market will behave the same way.
Who can redeem USDT for dollars?
Redemption is the route that can connect the secondary market price to the issuer's stated dollar value. Direct redemption is available only to eligible customers who complete the issuer's requirements and satisfy its minimums and operating conditions. Most people trading a small balance on an exchange cannot send that balance directly to the issuer and receive a dollar from it.
That access difference matters. If USDT trades below a dollar, an eligible customer may be able to buy it and redeem it, but an exchange trader without direct access cannot necessarily do so. Verification, minimums, transfer time, banking access, fees, and operational risk all affect whether the trade is practical. Redemption can anchor prices without making the price on every order book exactly one dollar.
The arbitrage band around a peg
Suppose USDT is available below $1. A participant who can acquire it cheaply and redeem it may buy, transfer, and redeem for dollars. That buying pressure can pull the market price upward. If USDT trades above $1, an eligible participant might create or sell into the premium, increasing supply and pushing the price back down.
In practice, neither direction is automatic. Trading, network, and banking fees matter. Transfers take time, redemption may have eligibility requirements, and a price can move before the full route is complete. The gap has to be large enough to cover the costs and risks for the particular participant. This cost-and-access range is often called an arbitrage band; it is not one universal threshold.
Most holders therefore trade USDT with other market participants rather than redeeming directly. The price can sit slightly below or above one dollar while the market clears, even when the mechanism is working as intended.
Quote demand also moves the price
USDT is used as a quote currency for many crypto pairs. Traders may want it to enter or leave positions without converting through a bank account, and that convenience can increase demand. At other times, sellers may prefer dollars or another stablecoin, putting temporary pressure on USDT.
The balance can differ by venue and region. A particular exchange's order book may be thin or dominated by one side. Fiat deposits and withdrawals may be available on different schedules from crypto transfers. Those local conditions can create a small difference even when the broader market remains close to its target.
What Coinmico measured
Coinmico's hourly USD-venue measurements covered 576 hours from 15 October through 7 November 2026. Kraken averaged $0.99870, with hourly closes from $0.99765 to $0.99927. Coinbase averaged $0.99870; Bitstamp averaged $0.99869; OKX $0.99875; Gemini $0.99871; Crypto.com $0.99889; and Binance.US $0.99889. On Kraken, 5.0% of hours were within 10 basis points of $1.
The averages cluster near $0.999, but the distribution matters. One venue's average does not guarantee a fill at that value, and an individual hourly close can be an outlier. Coinmico also measured a long-run daily-average range from $0.99796 to $1.00173 across 677 days, from 1 January 2025 to 8 November 2026. The index was below $1 on 59.8% of those days and never more than 50 basis points from $1 in that window.
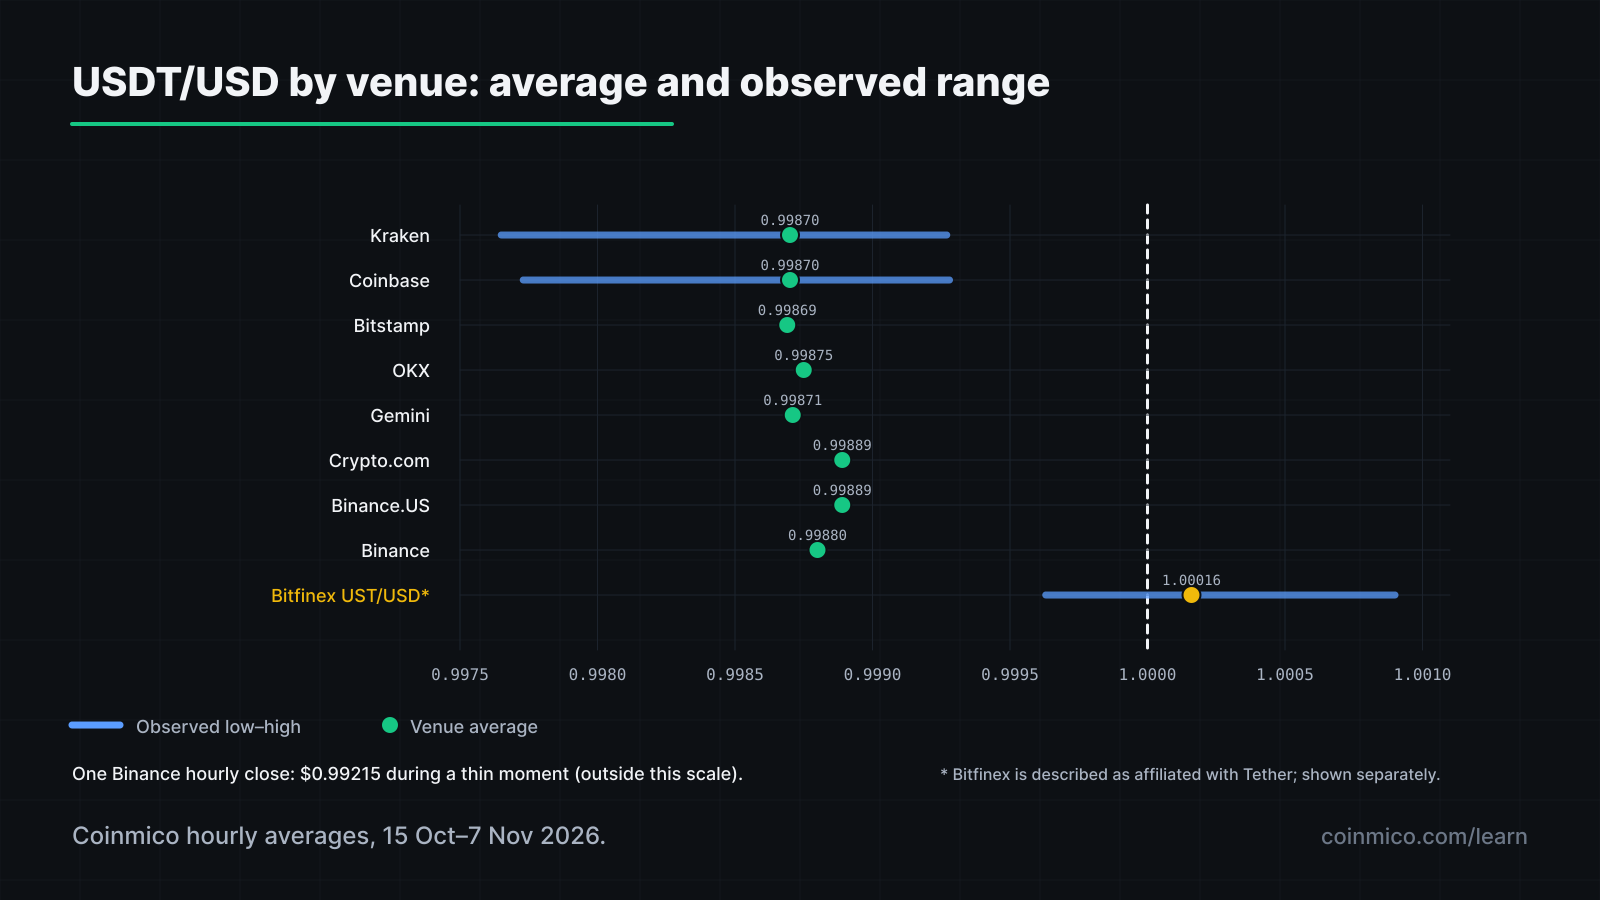
_Hourly closes measured by Coinmico from 15 October to 7 November 2026. The Bitfinex UST/USD reading is shown separately and is not presented as a typical independent venue quote._
These measurements show why “below one dollar” alone is not enough to describe the market. A price near $0.9987 was common across the measured USD venues in this window. A real loss of confidence or an impaired redemption route would be a different condition: look for a sustained, substantial break across independent markets, deteriorating liquidity, and evidence that the mechanisms supporting redemption or exchange have stopped functioning. A single low print is not by itself proof of a depeg.
How to check a USDT price
Start with direct USDT/USD pairs where available, rather than inferring the peg from a BTC/USDT or ETH/USDT quote. Compare several venues and note whether each figure is a last trade, an hourly close, or a live bid or ask. Then look at volume and order-book depth: a price formed by a small trade says less about the amount you can sell than a liquid market does.
Coinmico's live USDT reference is available below:
 TetherUSDTAcross 26 spot markets we index
Also compare USDT with other dollar-denominated markets, and check the timestamps. A venue quote that is stale, thin, or out of sync can look unusually high or low next to a current market.
Why Coinmico converts the quote instead of assuming $1
When Coinmico values a BTC/USDT market in dollars, it uses its measured USDT price. For example, in the snapshot described in Why Bitcoin's Price Differs Between Exchanges, a BTC/USDT quote of $75,918 multiplied by a USDT index of $0.99879 came to about $75,826. Treating USDT as exactly $1 would leave the quote currency's own discount out of the comparison.
The same principle applies to any asset quoted in a currency that can trade away from its reference value. Coinmico's price methodology explains how it measures those references.
Yield-bearing dollar tokens are a separate design. Their value may reflect accrued yield, redemption terms, or other product mechanics, so do not assume they are intended to trade at exactly one dollar.
What this means in practice
- For a direct USDT sale: compare the actual USD bid on more than one venue, and check depth and trading volume before estimating proceeds.
- For a crypto pair: convert the quote currency at its measured price. A raw BTC/USDT number is not automatically a USD price.
- For a possible depeg: look for a persistent break across multiple liquid markets and assess whether redemption and conversion routes still function. Do not infer a systemic problem from a single hourly wick.
- For a stablecoin comparison: check each token's own design and redemption terms. A dollar-related label does not make every token's price mechanism identical.
Next in this track
This completes the Reading market data track. Continue with the On-chain & DEXs track to see how prices form without a centralized order book, and return to Coinmico's price methodology for how measured quotes are combined.
Every figure here is measured by Coinmico across the venues and chains we index. See our methodology.