Market cap: what it measures and how it misleads
Market capitalisation is the number the whole industry ranks by, and it is one multiplication. Knowing what goes into each side of that multiplication is the difference between reading the ranking and being fooled by it.
What you will learn
- Market cap is price times circulating supply. It is not the money invested in a coin and not the money you could take out.
- The supply figure is the weak link — a coin with 5% of its tokens circulating can show a large cap on almost no real money.
- Fully diluted valuation shows what the cap would be if every token existed today; a wide gap between the two is a warning about future selling.
Open any market table, including [Coinmico's](/), and the coins are ranked by market cap. It is the most quoted figure in crypto and one of the most misread. This lesson explains what the number is, what it is not, and the two or three checks that stop it misleading you.
The formula
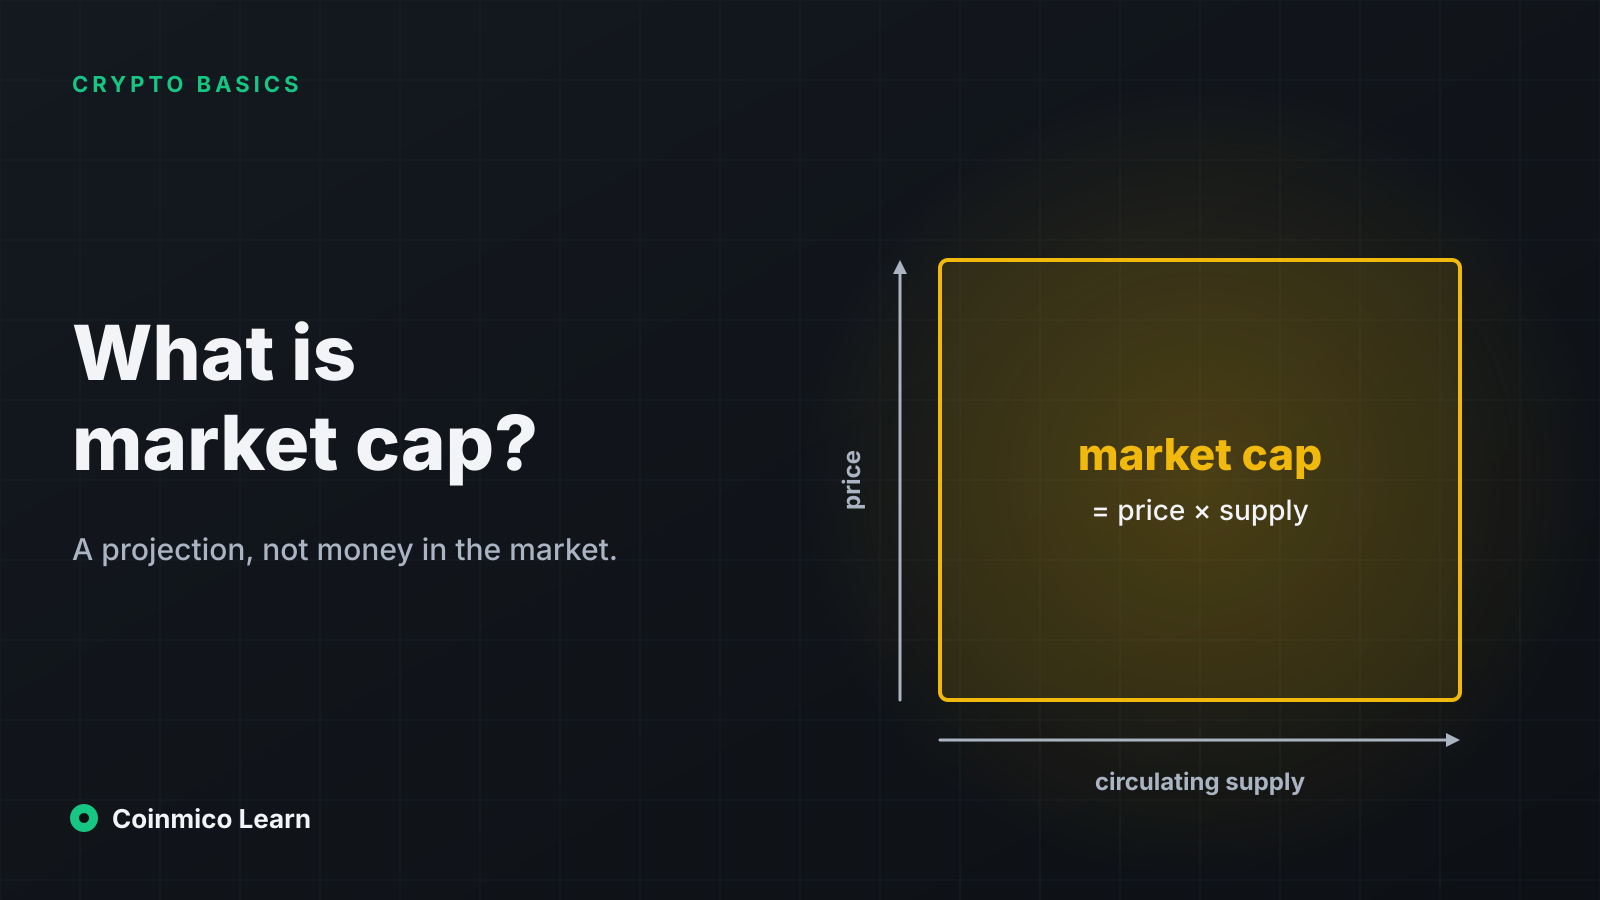
Market cap = price × circulating supply.
That is the entire definition. If a coin trades at 2 dollars and 500 million of them are in circulation, its market cap is 1 billion dollars.
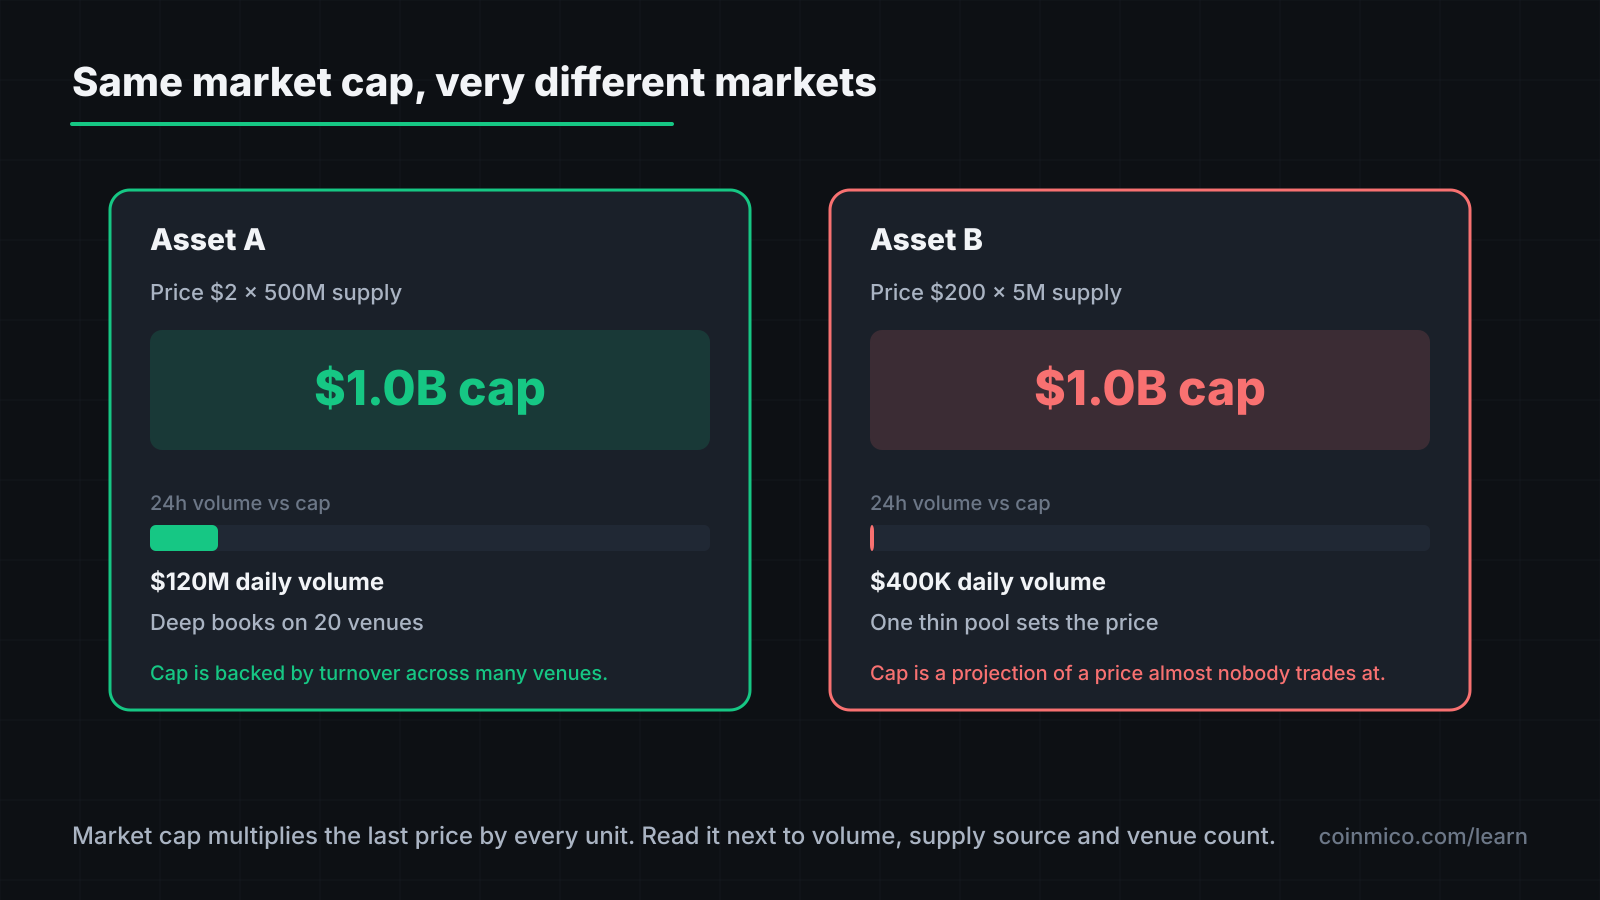
Two immediate consequences:
- Market cap is not money that went in. Nobody paid a billion dollars for that coin. The figure is the price of the most recent trade applied to every coin in existence, including the vast majority that have never traded.
- Market cap is not money that could come out. If holders tried to sell even a fraction of the supply, the price would fall long before they finished. The billion dollars is a valuation, not a balance.
Bitcoin's own figure, as measured right now:
 BitcoinBTCAcross 50 spot markets we index
Why the ranking uses it anyway
Despite the caveats, market cap is the fairest single way to compare coins of very different prices. A coin at 0.0001 dollars is not "cheaper" than one at 100 dollars — the price alone tells you nothing until you know how many exist. Multiplying by supply puts them on the same scale.
It also tells you roughly how much money would be needed to move the price. Pushing a 500-billion-dollar asset up 10% takes a great deal more buying than pushing a 5-million-dollar one, which is why large caps move slowly and small caps swing violently.
The weak link is supply
Price is measured from trades, continuously. Supply is a different kind of number: it has to be read from the chain or reported by the project, and the definitions are slippery.
Circulating supply is meant to be the coins that are freely tradeable — excluding those locked in vesting contracts, held by the foundation, burned, or otherwise unavailable. Different data sites draw those lines differently, which is why the same coin can rank 40th on one site and 55th on another.
Coinmico reads supply from the chain wherever it can (total supply minus known burn, treasury and locked addresses) and falls back to the project's reported figure only when it cannot. Each coin page states which method was used. The methodology lists the rules.
Low float, high cap
The trap to watch for: a newly launched token with 5% of its eventual supply circulating. It can post a market cap of hundreds of millions on a few million dollars of actual trading, because the price is set by a small float while the cap multiplies it across everything unlocked so far. As more tokens vest, supply rises — and unless demand rises as fast, price falls.
Fully diluted valuation
Fully diluted valuation (FDV) = price × maximum supply. It answers the question: if every token that will ever exist were in circulation at today's price, what would the cap be?
The ratio between market cap and FDV is the check:
| Market cap ÷ FDV | What it suggests |
|---|---|
| Near 100% | Almost all supply is out. Bitcoin is at roughly 95%. Little future dilution. |
| 50–80% | Meaningful supply still to be released. Look up the vesting schedule. |
| Below 30% | Most tokens are still locked. Current price is set by a small float and will face steady selling as they unlock. |
Coins with no maximum supply — Ethereum, Solana, most proof-of-stake coins — have no FDV in the strict sense; their supply grows by a known issuance rate and shrinks by fees burned. For those, look at the net issuance rate instead.
Reading a ranking properly
- Check the markets count. A high cap with prices measured on only two or three venues is fragile.
- Check cap versus volume. A coin with a cap of 1 billion and daily volume of 200,000 dollars is barely trading; its cap is a label on an illiquid asset. As a rough rule, established coins turn over a few percent of their cap a day.
- Check cap versus FDV. A wide gap means a queue of future sellers.
- Check supply source. On-chain measured supply is a fact; project-reported supply is a claim.
The compare block below shows how two large caps have moved together over the last quarter — the kind of view that makes relative size, not just price, visible:
Total market cap
Adding every coin's cap together gives the total crypto market cap on the global page. Coinmico excludes wrapped and bridged copies so bitcoin held as WBTC is not counted twice, and excludes tokenised stocks and similar real-world assets whose value belongs to another market. The total is a mood indicator more than a precise figure — its direction matters more than its level.
What this means in practice
- Use market cap to compare sizes, never to estimate how much money is "in" a coin.
- Treat a wide cap-to-FDV gap as a schedule of future selling, and find out when it happens.
- Prefer measured supply to reported supply, and be sceptical of any ranking that does not tell you which it used.
Next in this track
Market cap tells you how big a coin is. Volume tells you whether anyone is actually trading it — and volume is the figure most easily faked. The next lesson shows how to tell reported volume from measured volume.
Assets in this piece
 Bitcoin
 Ethereum
 XRP
XRPEvery figure here is measured by Coinmico across the venues and chains we index. See our methodology.