Why Bitcoin's price differs between exchanges
Bitcoin has no single exchange-wide last trade. Separate order books, quote currencies, timing, and arbitrage costs can all create visible price differences.
What You Will Learn
- "Every exchange has its own order book, so venue prices can differ even when they trade the same Bitcoin market."
- "A BTC/USDT quote should be converted using USDT's measured USD price; treating one USDT as exactly $1 can make a normal quote look like a premium."
- "Coinmico's index combines measured venue data rather than taking a single exchange's last trade as the market price."
Bitcoin does not have one global order book. Each exchange matches its own buyers and sellers, and each pair has its own quotes. A BTC/USD trade, a BTC/USDC trade, and a BTC/USDT trade may therefore show different numbers at the same moment without any one of them being a mistake.
Coinmico measured an example at the hourly close at 03:00 UTC on 8 November 2026. The snapshot shows how much of an apparent difference can come from the quote currency itself, before fees, timing, or a thin order book are considered.
Each exchange matches its own orders
An order book is a venue's list of bids and asks for a particular trading pair. The best bid and ask change as traders place, cancel, and fill orders. There is no central exchange that forces every venue's last trade to match.
If buyers are more aggressive on one venue, its last traded price can sit above another venue's. A seller can also sweep several price levels on a thin book, leaving a trade that is far from the prices available elsewhere. The discrepancy may last only briefly, or it may persist while the venues' customers and order flow differ.
The same is true for different pairs on the same venue. BTC/USD and BTC/USDT are separate books: a price shown in USDT is not automatically a price in US dollars. For a refresher on how venue activity can vary, see How to Read Trading Volume.
The quote currency can explain an apparent premium
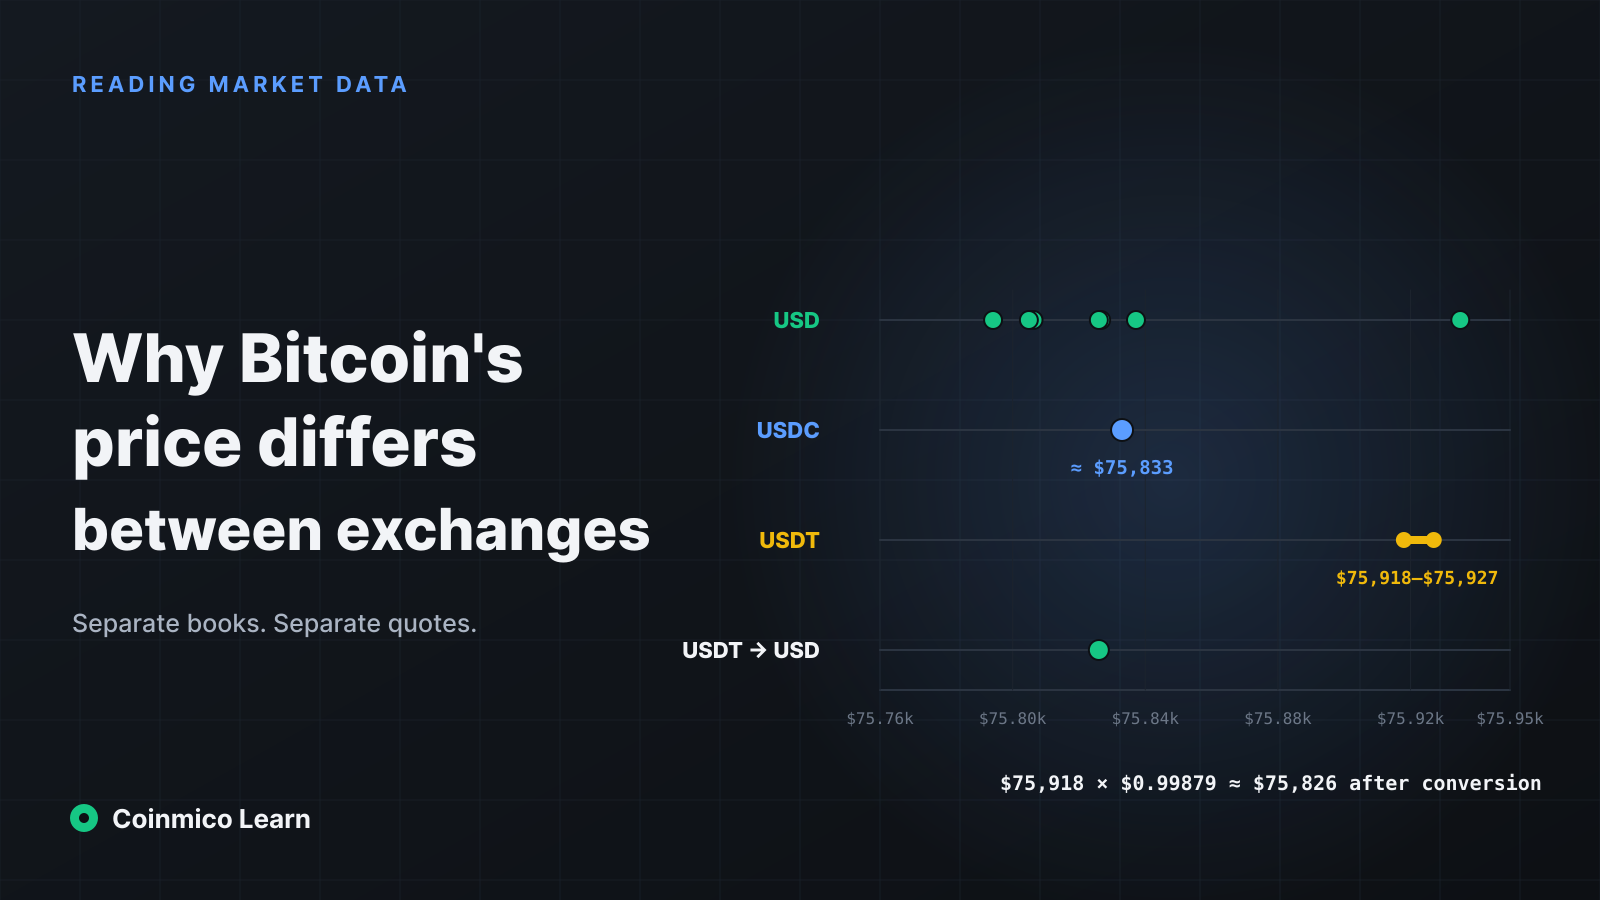
Coinmico's snapshot at 03:00 UTC on 8 November 2026 put its Bitcoin index at $75,844.6 and its USDT index at $0.99879. The measured USD spot quotes across seven venues—Bitfinex, Crypto.com, Gemini, Binance.US, Coinbase, Bullish, and Bitstamp—ranged from $75,794.1 to $75,935.0, a spread of about $141, or roughly 19 basis points. USDC pairs clustered around $75,833, while USDT pairs were around $75,918–$75,927.
At first glance, the USDT quotes look higher. Convert the quote currency before comparing:
$75,918 per BTC × $0.99879 per USDT ≈ $75,826 per BTC.
That converted value is close to the observed USD quotes, including Binance.US at $75,826.0. The apparent USDT premium largely disappears once each USDT is valued at Coinmico's measured dollar price instead of being assumed to equal exactly one dollar.
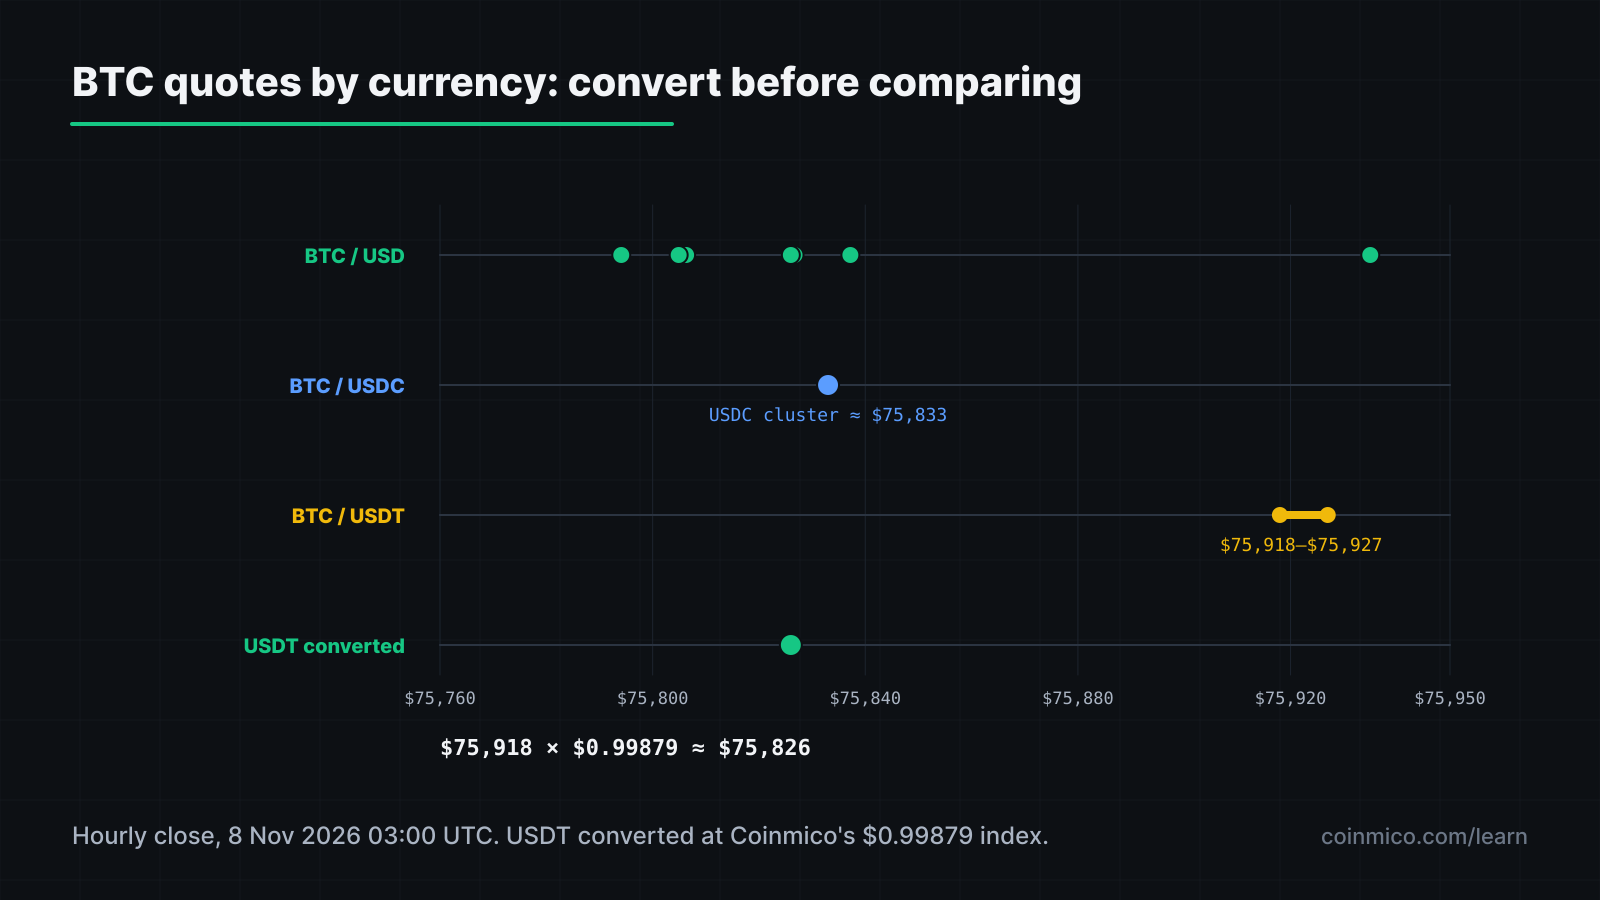
_Hourly-close snapshot at 03:00 UTC on 8 November 2026. BTC/USD venue values are USD quotes; the example USDT value is converted using Coinmico's USDT index of $0.99879._
The calculation is specific to that snapshot. Quote prices change, and a different pair or time may produce a different relationship. For more on small stablecoin price deviations, read Why USDT Trades Below One Dollar.
 BitcoinBTCPrice, last 30 days-8.97%
Why arbitrage does not erase every difference
When one venue's Bitcoin price is higher, a trader might buy on a cheaper venue and sell on the more expensive one. That is arbitrage: trading the difference in the hope that the two prices converge. It can connect markets, but it is not frictionless.
Trading fees reduce the gap a trader can keep. Moving funds between venues can incur withdrawal and network fees, take time, or be limited by an exchange's withdrawal rules. Fiat deposits and withdrawals may use different rails and processing schedules. A trader also needs capital on both venues and must accept counterparty, settlement, and price risk while the transfer or trades happen.
Those constraints create an arbitrage band: a difference can remain when the potential gain is too small or too uncertain to cover all the costs and risks. The size of that band is not one fixed number for every trader or venue.
Regional demand and quote currencies
Local demand can push a market away from prices elsewhere. A well-known concept is the “kimchi premium”: a higher local Bitcoin price in a market where access to external venues, local payment methods, or capital movement differs. It describes a pattern, not a guaranteed profit; the practical ability to move money across those markets may be restricted or costly.
Demand for a quote currency matters too. Traders may prefer one stablecoin or fiat pair because it is easier to fund, more liquid for their region, or more useful for their other positions. A BTC/USDT price can therefore reflect both Bitcoin demand and demand for USDT. Comparing raw quote numbers without converting them combines those two effects.
Last-trade timing and thin-book outliers
Displayed prices are not always simultaneous. The snapshot above used hourly closes, and one venue may have recorded its close seconds or minutes before another. During a fast move, even small timing differences can widen a comparison. Coinmico's hourly spread series uses eight USD spot venues, with about seven reporting in a typical hour; it includes only hours with at least five venue observations, from 15 October to 7 November 2026. Across 576 hourly observations, the median max-to-min spread relative to the median price was 16.2 basis points; the 90th percentile was 22.7 basis points. The maximum was 95.2 basis points. Those figures include timing effects because the closes are not synchronized.
An outlier can also come from a very small trade. In the same data file, one venue recorded a BTC close at $75,739 on only $813 of hourly volume. That print is not a reliable summary of the broader market; its small volume is essential context. Coinmico does not name that venue here because the lesson is about the thin-book condition, not a venue ranking.
What an index price does
An index is a reference value built from prices measured across selected markets. Rather than treating one exchange's latest trade as the whole market, Coinmico evaluates venue data together and accounts for the methodology described in How Coinmico Measures Crypto Prices. An index is useful for comparison and analysis, but it is not a promise that every venue will let you trade at exactly that value.
The Exchanges directory helps you inspect venues, and the Bitcoin market page shows Coinmico's current view of Bitcoin. Compare the actual pair, venue, timestamp, spread, and depth before acting.
What this means in practice
- Compare like with like: identify whether each quote is USD, USDC, or USDT. Convert non-USD quotes using the measured value of the quote currency.
- Check the trade, not just the headline price: look at the venue's bid and ask, available depth, and when the last trade occurred. A thin print may not be executable at size.
- Include the full arbitrage cost: fees, funding, withdrawal limits, fiat rails, and transfer time can make a visible gap impossible to capture.
- Use an index as a reference: it can smooth venue-specific noise, but your execution still happens on a particular venue and pair.
Next in this track
The next lesson looks at why USDT can trade below one dollar and how that changes the conversion of BTC/USDT quotes.
Every figure here is measured by Coinmico across the venues and chains we index. See our methodology.