How to read trading volume — reported vs measured
Volume is the figure that tells you whether a price is real. It is also the figure exchanges have the most incentive to exaggerate. Here is how to read it, where the distortions come from, and what changes when you count trades yourself.
What you will learn
- Volume is the value of coins that changed hands in a period. It is what gives a price its weight.
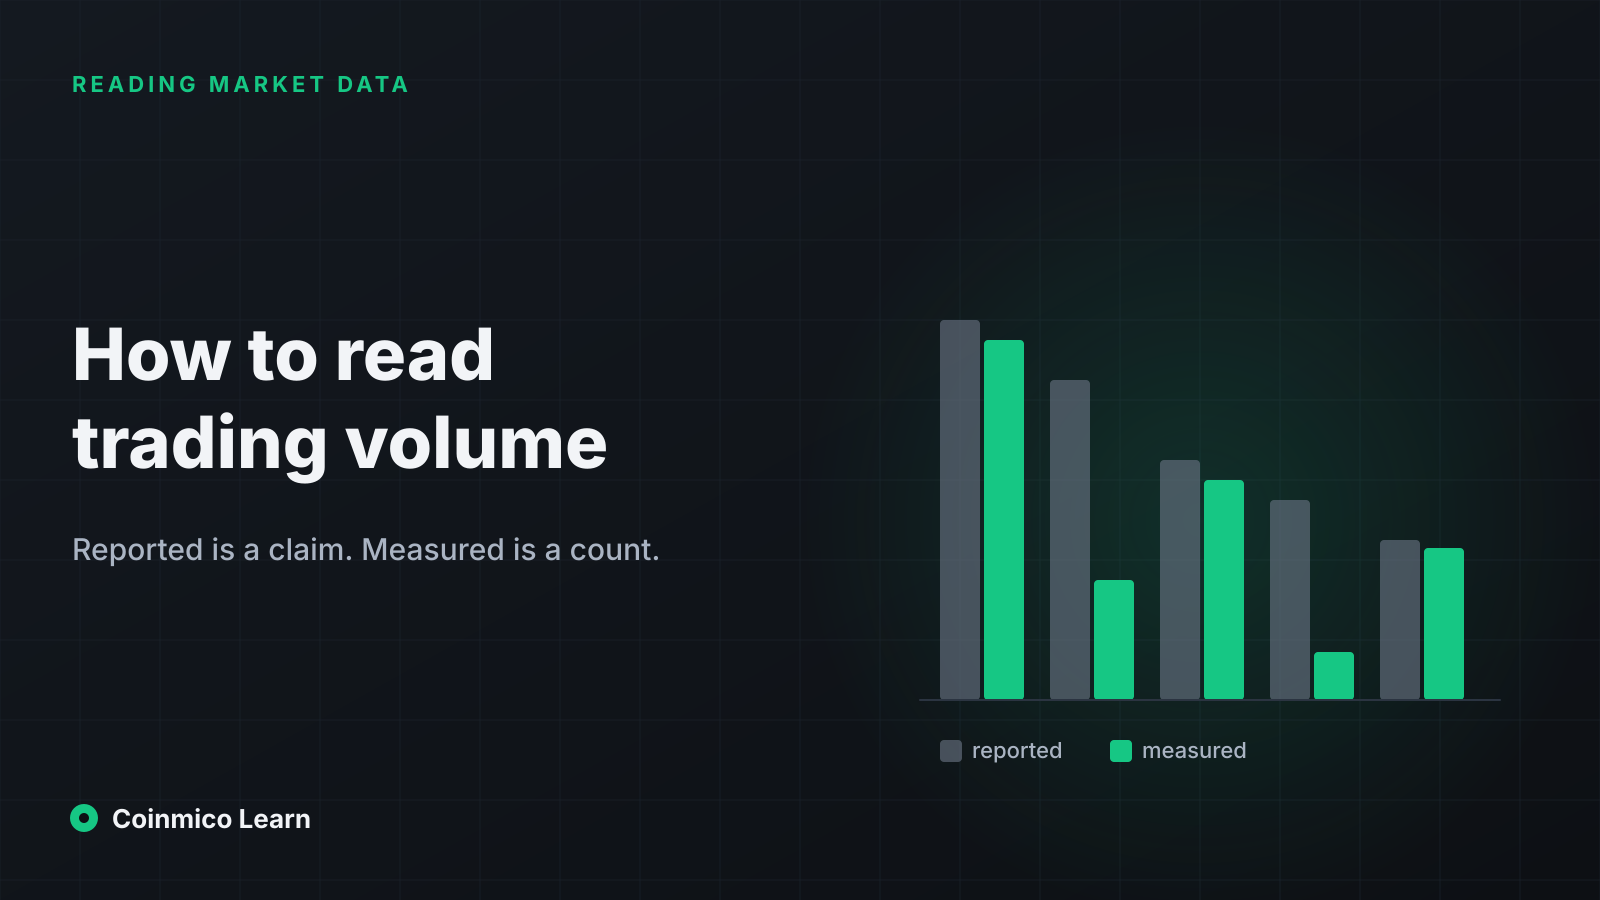
- Reported volume is whatever an exchange publishes; measured volume is the sum of trades observed on its live feed. They can differ enormously.
- Compare volume to market cap, watch for volume concentrated on one venue, and treat a price move without volume as suspect.
A price with no volume behind it is a rumour. A price with deep volume behind it is a fact you can act on. Volume is the figure that separates the two — which is exactly why it is the figure most often inflated.
What volume is
Volume is the total value of an asset traded in a period, almost always quoted for the last 24 hours and in US dollars. If 1,000 BTC changed hands at an average of 87,000 dollars, the 24-hour volume is 87 million.
It answers a simple question: how much would I be able to buy or sell without moving the price? Deep volume means many willing counterparties at prices close to the current one. Thin volume means your own order would be the news.
Reported vs measured
There are two ways to arrive at a volume figure, and they are not the same.
Reported volume is the number an exchange publishes about itself, usually via a summary endpoint updated every few seconds. Most data sites collect these summaries and add them up.
Measured volume is the sum of individual trades observed on the exchange's live trade feed — each with its own price, size and timestamp — converted to dollars one by one.
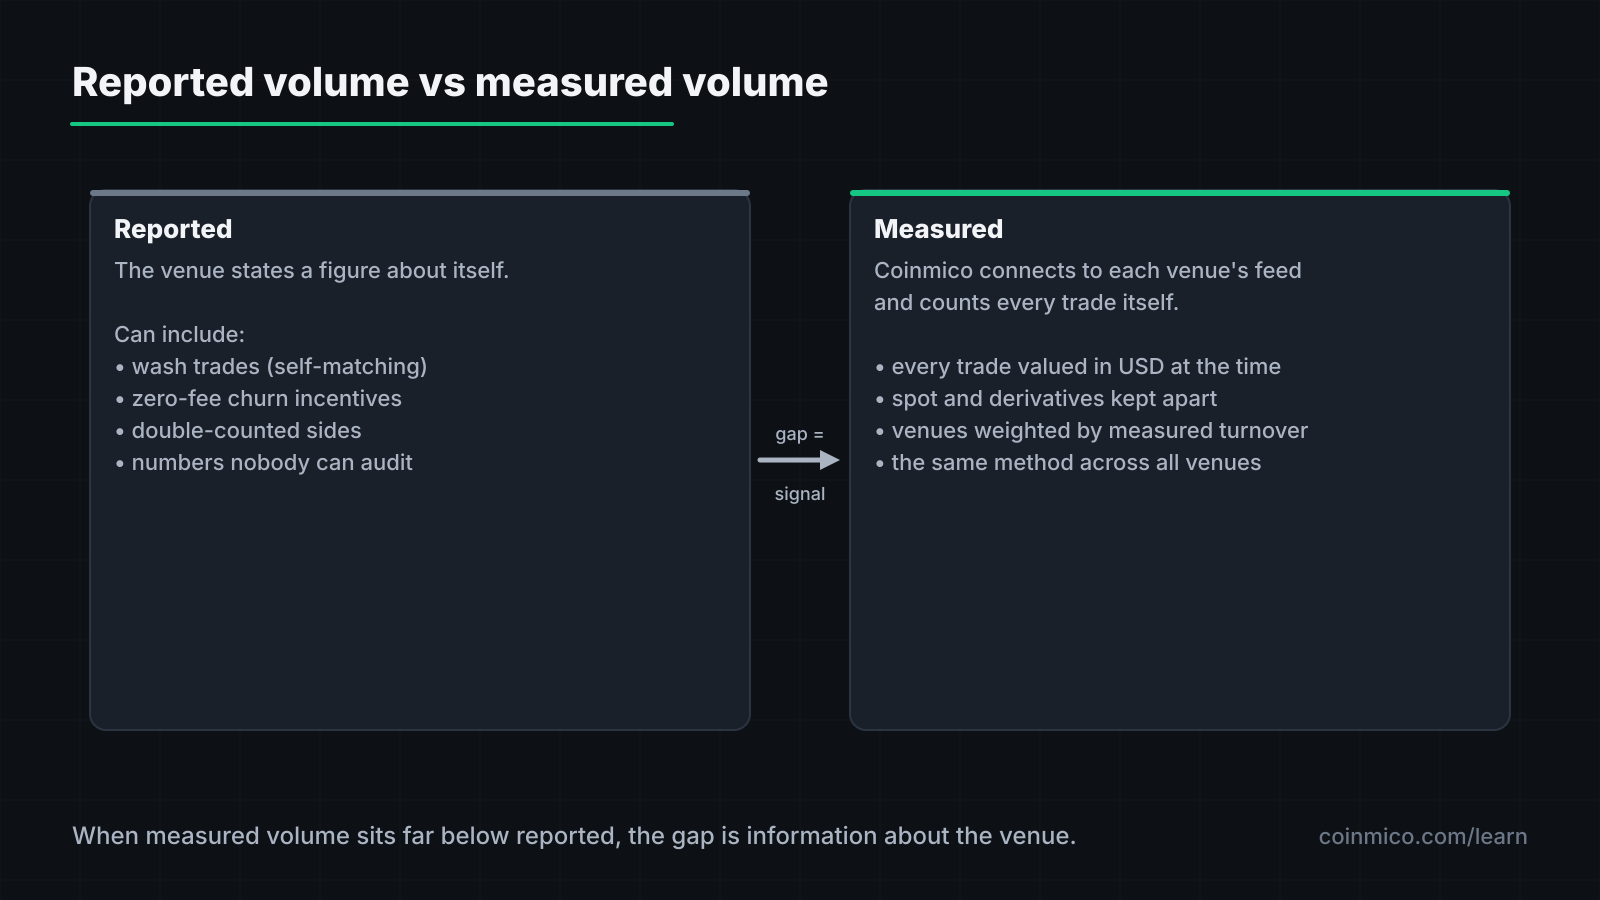
Coinmico uses the second method for every venue it lists. The volume you see on an exchange page or in a coin's markets table is the total of trades we watched happen. Where a venue's own reported figure differs sharply from what we observed, the gap itself is information.
Why the two diverge
Wash trading
An exchange, or a market maker it pays, trades with itself: a buy and a matching sell at the same price, over and over. Each pass adds to volume and moves nothing. It makes a venue look busier than it is, which pulls in listings and users. Self-reported summary figures are trivial to inflate this way. A live trade feed is harder — the fake trades have to be broadcast individually, where their pattern (round sizes, unchanging price, metronomic timing) is visible.
Incentivised trading
Zero-fee promotions and trading rewards produce real trades that no one would place otherwise. The volume is genuine but the demand is not; it evaporates when the promotion ends.
Double-counting
Some summaries count both sides of a trade, or add derivatives volume to spot. Measured trade-by-trade volume counts each trade once and keeps spot and derivatives separate.
Honest differences
Not every gap is sinister. Feeds drop messages under load, a venue may batch trades, and the dollar conversion of a won- or rupiah-quoted pair depends on the exchange rate used. Measured volume is a lower bound with a known method, not a perfect truth.
Four checks to run on any volume figure
1. Volume versus market cap. Divide daily volume by market cap. Established large caps typically turn over 1–5% a day. A coin turning over 50% of its cap every day is either in the middle of a major event or its volume is not what it seems. A coin turning over 0.1% is barely trading, whatever its cap says.
2. Where the volume is. Open a coin's markets table. If 90% of the volume comes from one venue you have never heard of, the price rests on that venue. Bitcoin's volume is spread across dozens of exchanges; that breadth is part of what makes its price robust.
3. Volume with price. A large price move on rising volume means many participants agreed on the new price. The same move on flat or falling volume means a few orders pushed a thin book — and it is likely to reverse.
4. Spot versus derivatives. A coin whose derivatives volume dwarfs its spot volume is being traded mostly as a bet, not held. That is normal for large caps, but on a small coin it means the price is being set by leveraged positions that can unwind fast.
Volume on Coinmico
Every figure below is measured from trade feeds, converted at the exchange rate in force at the time of each trade. The ranking of coins by 24-hour volume:
| Coin | Price | 24h | 24h volume | Market cap |
|---|---|---|---|---|
 BitcoinBTC BitcoinBTC | $84,055.62 | 2.82% | $21.00B | $1.69T |
 EthereumETH EthereumETH | $2,663.27 | 3.13% | $9.38B | $325.1B |
 USDCUSDC USDCUSDC | $1.00 | 0.01% | $5.60B | $75.14B |
 XRPXRP XRPXRP | $1.50 | 4.66% | $3.91B | $94.21B |
 SolanaSOL SolanaSOL | $114.27 | 3.00% | $2.63B | $67.14B |
 ZcashZEC ZcashZEC | $1,525.56 | 1.95% | $1.81B | $25.85B |
 NEAR ProtocolNEAR NEAR ProtocolNEAR | $4.34 | 2.09% | $1.48B | $5.68B |
 TetherUSDT TetherUSDT | $0.9999 | 0.01% | $1.19B | $183.5B |
 DogecoinDOGE DogecoinDOGE | $0.0924 | 7.36% | $1.14B | $14.41B |
 UniswapUNI UniswapUNI | $9.21 | 0.60% | $1.05B | $5.72B |
And bitcoin's volume history, which shows how much turnover varies day to day even for the deepest market:
BitcoinBTC24h volume, last 90 days+262.75%On an exchange page, the volume figure is the sum across every pair we track on that venue, and the pair table beneath it shows the breakdown. On a coin page, the markets tab lists every venue and pair with its measured share.
What this means in practice
- Treat exchange-reported volume as a claim and measured volume as a record; when they disagree, ask why.
- Never read a price without its volume. The two together tell you how much the price would move if you traded it.
- A venue's rank by volume is only as good as the method behind it. Coinmico's methodology states the method for every number.
Next in this track
Market cap and volume describe individual coins. The next lesson steps back to the whole market and explains dominance, breadth and the altcoin-season signal.
Assets in this piece
 Bitcoin
 Ethereum
Every figure here is measured by Coinmico across the venues and chains we index. See our methodology.