Liquidations: how a 3% move becomes a 15% crash
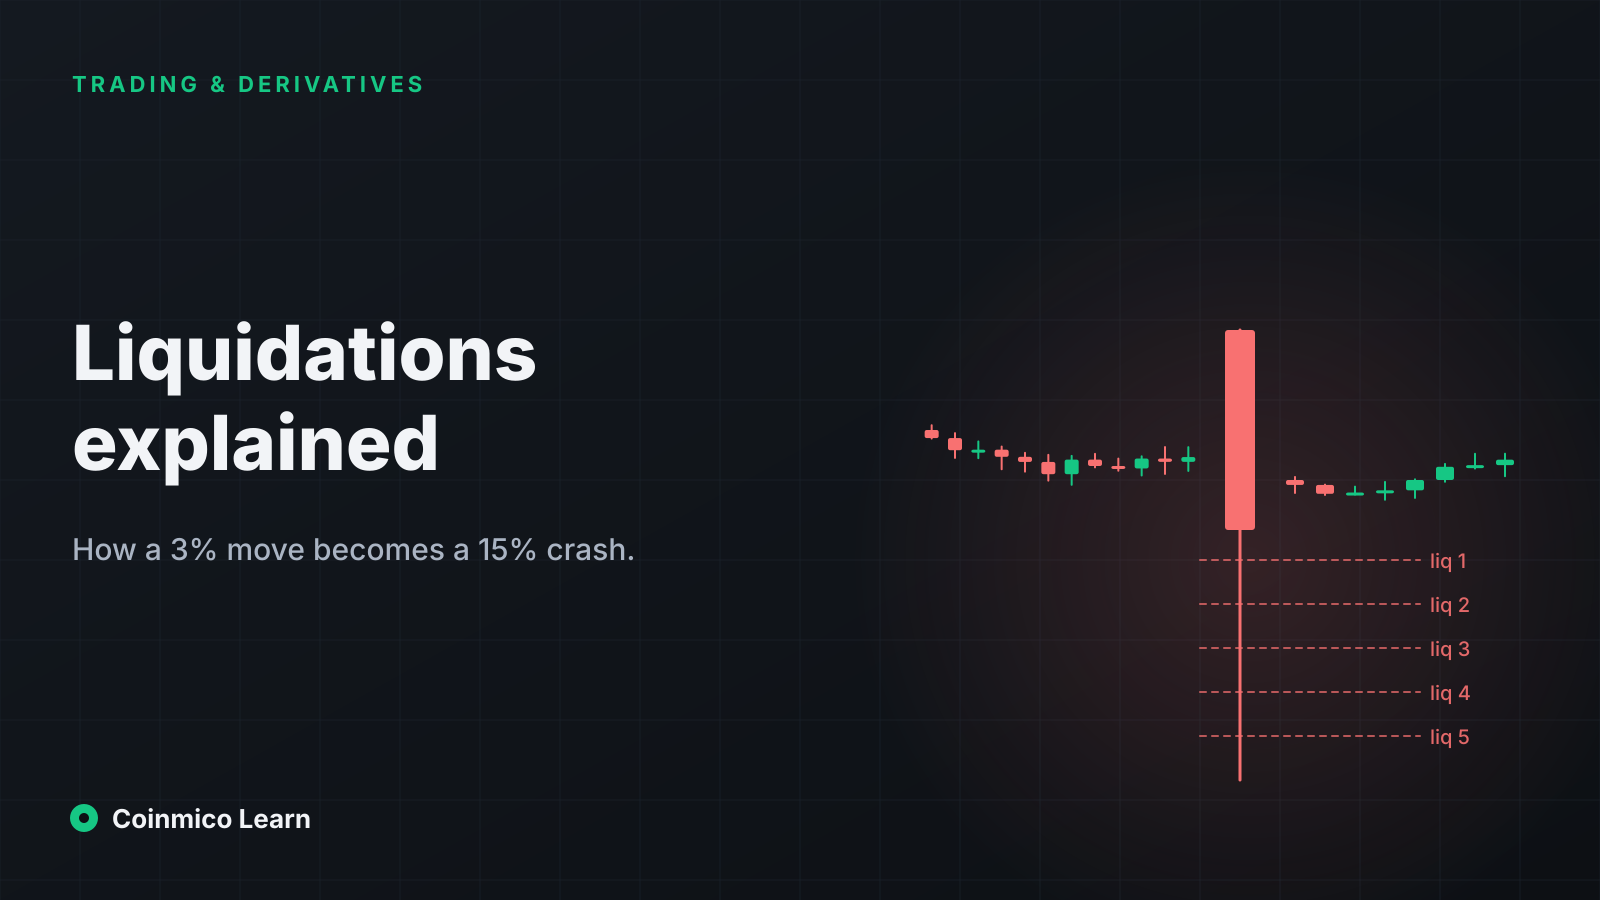
A liquidation is the exchange closing a leveraged position because its margin ran out. One is harmless. Thousands at the same price level, each one pushing the price into the next, is how crypto produces its trademark vertical candles.
What you will learn
- A position is liquidated when losses reduce its margin to the maintenance level. The exchange closes it at market, and that forced order moves the price.
- Cascades happen because leveraged positions cluster at similar levels. Each forced close triggers the next, and the move only stops when the cluster is exhausted.
- Liquidation totals show you which side was flushed. Large long liquidations after a fall often mark a local low; large short liquidations after a spike often mark a local top.
Crypto's most recognisable chart pattern is the wick: a candle that plunges 10% in minutes and recovers most of it within the hour. Almost every one of them is a liquidation cascade. This lesson explains the mechanism, from a single position running out of margin to the chain reaction that follows.
One liquidation
Recall from the perpetuals lesson that a leveraged position is backed by margin, and that as the price moves against it the unrealised loss is subtracted from that margin.
Exchanges set a maintenance margin — the minimum the position must retain, usually 0.5–2% of notional. When the mark price moves far enough that margin falls to that level, the liquidation engine takes over:
- The position is closed at market. A long is sold; a short is bought back.
- Whatever margin remains after the close, minus a liquidation fee, is returned. Often that is nothing.
- If the close fills worse than the maintenance level — so that margin goes below zero — the exchange's insurance fund covers the shortfall.
The liquidation price is the level at which this happens. At 10× leverage on a long, it sits roughly 9–9.5% below the entry, depending on the maintenance rate. At 50×, about 1.5% below.
Why one becomes many
The liquidation engine's market sell is an ordinary order on the book. It consumes bids and pushes the price down. If another position's liquidation level sits just below, the engine's own selling triggers it. That position's forced sell pushes the price further, into the next one.
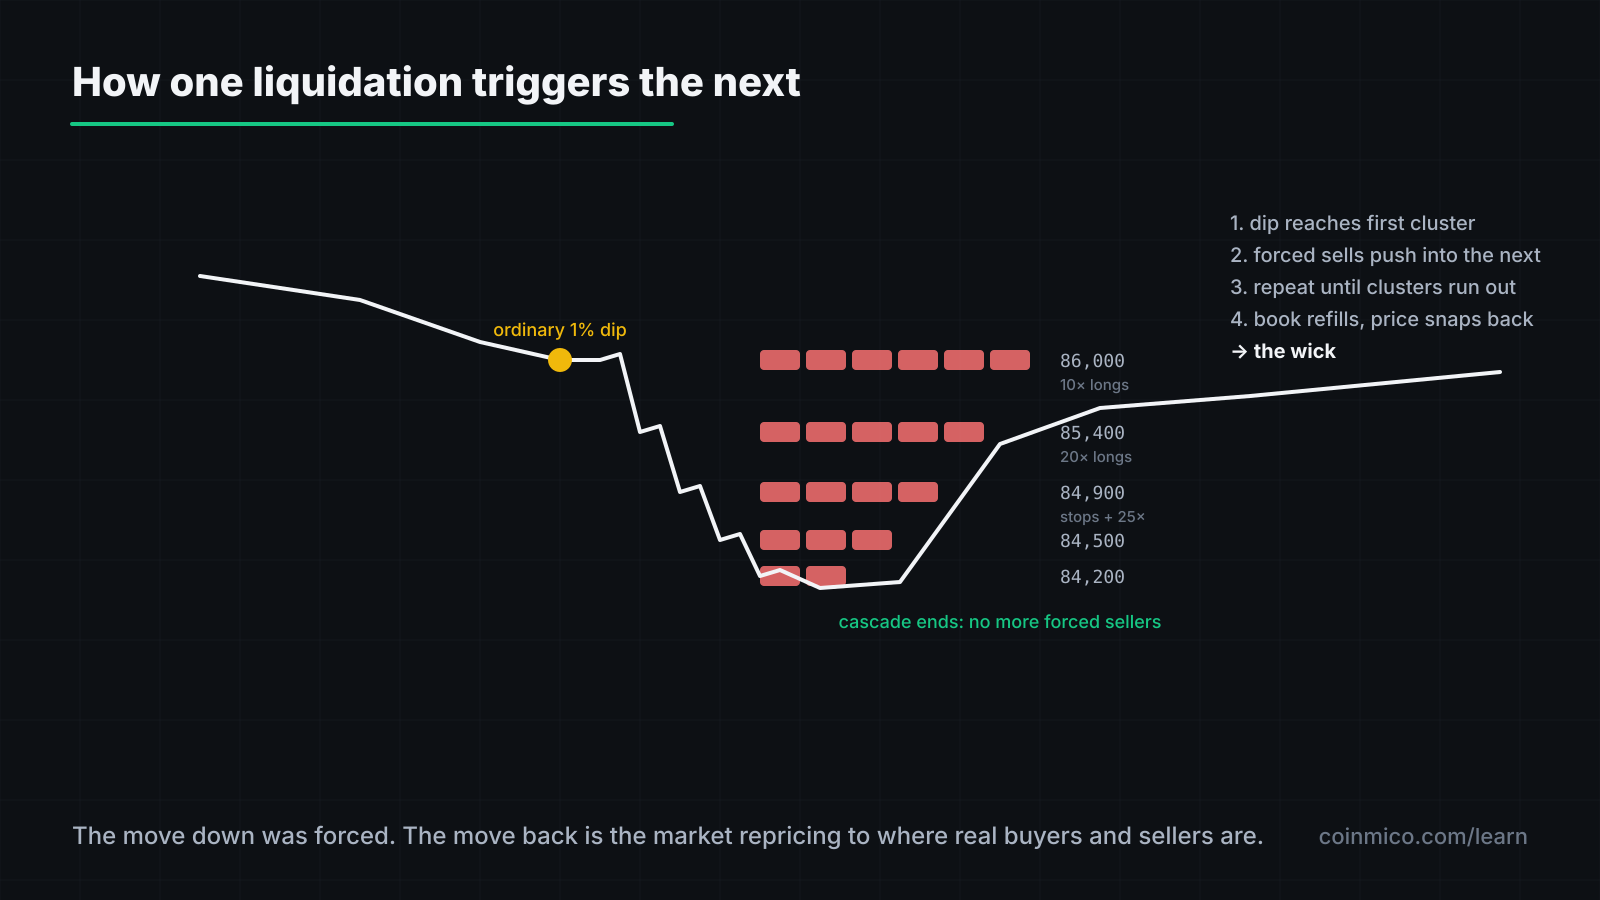
The reason this chains rather than fizzles is clustering. Traders open positions at similar times and similar leverage, so their liquidation levels sit in bands. Round numbers attract entries, so levels cluster below round numbers. A modest spot move into the first band sets off the whole sequence.
Three things make a cascade worse:
- High open interest relative to spot depth. The forced orders are large compared with the bids available to absorb them. The OI lesson covers how to scale it.
- Thin books. At night, at weekends, or after news, resting orders are pulled and the same sell moves the price further.
- Stop-losses stacked in the same zone. Spot traders' stops sit at the same round numbers and add to the selling.
The cascade ends when the bands are exhausted. Below the last cluster there is no more forced selling, the book refills, and the price snaps back — which is why the wick recovers. The move down was forced; the move back is the market repricing to where willing buyers and sellers actually are.
Short squeezes
The same mechanism runs upward. Short positions are liquidated by a forced buy, which pushes the price up into the next short's liquidation level. Because shorts are often crowded after a long decline — visible as negative funding — a small bounce can trigger a squeeze that looks like sudden bullish news and is nothing of the kind.
Reading liquidation data
Coinmico derives 24-hour liquidation totals from the perpetual venues it covers and shows them, split into longs and shorts, in a coin's derivatives panel. Read them as a record of who was flushed:
| Observation | Reading |
|---|---|
| Large long liquidations, price now stable or rising | Longs were cleared. Leverage is lower and the path up has fewer forced sellers. Often a local low. |
| Large short liquidations, price now stable or falling | Shorts were cleared. The squeeze fuel is spent. Often a local top. |
| Large liquidations on both sides | A whipsaw: a move down that triggered longs, then a move up that triggered shorts. Volatility, not direction. |
| Price fell sharply but liquidations were small | Not a cascade — spot selling. Likely to have more follow-through, because no forced positions were behind it. |
The size that counts as "large" depends on the coin. Compare the day's total to the coin's open interest: liquidations of 5–10% of OI in a day is a meaningful flush; 30% is a full reset.
Mark price and the insurance fund
Two design details protect traders from the worst versions of this.
Mark price. Liquidations trigger on the mark price — an index of spot prices plus a smoothed premium — not on the perp's own last trade. A single large order on one venue can spike that venue's last price without moving the mark, so it cannot liquidate positions on its own.
Insurance fund and auto-deleveraging. When a liquidation fills below the bankruptcy level, the insurance fund absorbs the loss. If the fund is exhausted, exchanges resort to auto-deleveraging (ADL): profitable positions on the opposite side are forcibly reduced to cover the shortfall. ADL is rare and is the reason a winning position can be closed without warning during extreme events.
What this means in practice
- Know your liquidation price before you open, and place it below the obvious clusters, not within them.
- A vertical wick with heavy liquidations is a forced move. The price that matters is where it settled afterwards.
- Watch OI relative to depth. When it is high, every move has a cascade waiting in it.
The two markets where this plays out most visibly, side by side:
Where to go from here
You have finished the Trading & derivatives track. The On-chain & DEXs track moves to markets with no order book at all — where a formula, not a matching engine, sets the price.
Assets in this piece
 Bitcoin
 Ethereum
Every figure here is measured by Coinmico across the venues and chains we index. See our methodology.