Funding rate and open interest: reading a crowded trade
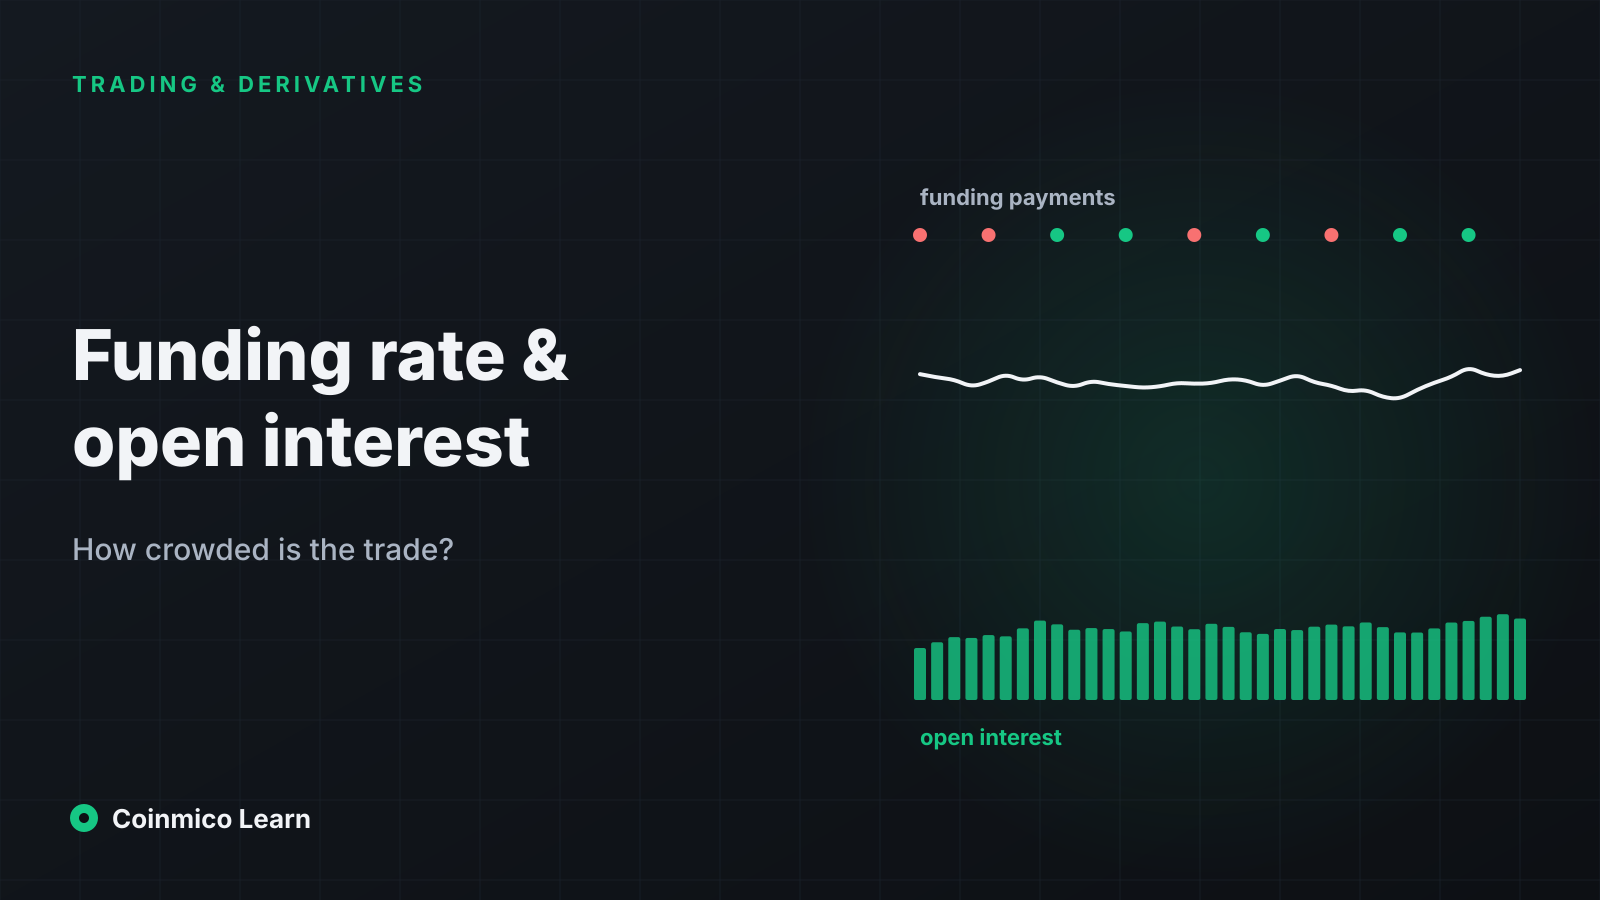
Price tells you where the market is. Funding and open interest tell you how many people are leaning on it, and in which direction. Together they are the best early warning of a violent unwind.
What you will learn
- Funding rate is the periodic payment between longs and shorts. Persistently high positive funding means longs are crowded and paying to stay in.
- Open interest is the total value of positions currently open. It measures how much leverage is in the market, not how much trading is happening.
- Rising price with rising OI is new money entering a trend. Rising price with falling OI is shorts being forced out — a move that ends when they are gone.
Two traders can look at the same bitcoin chart and disagree about what happens next. Add funding and open interest and one of them usually stops arguing. These two figures describe the derivatives market's positioning — how much leverage is out there and who is paying to hold it — and positioning is what turns an ordinary move into a cascade.
Funding rate
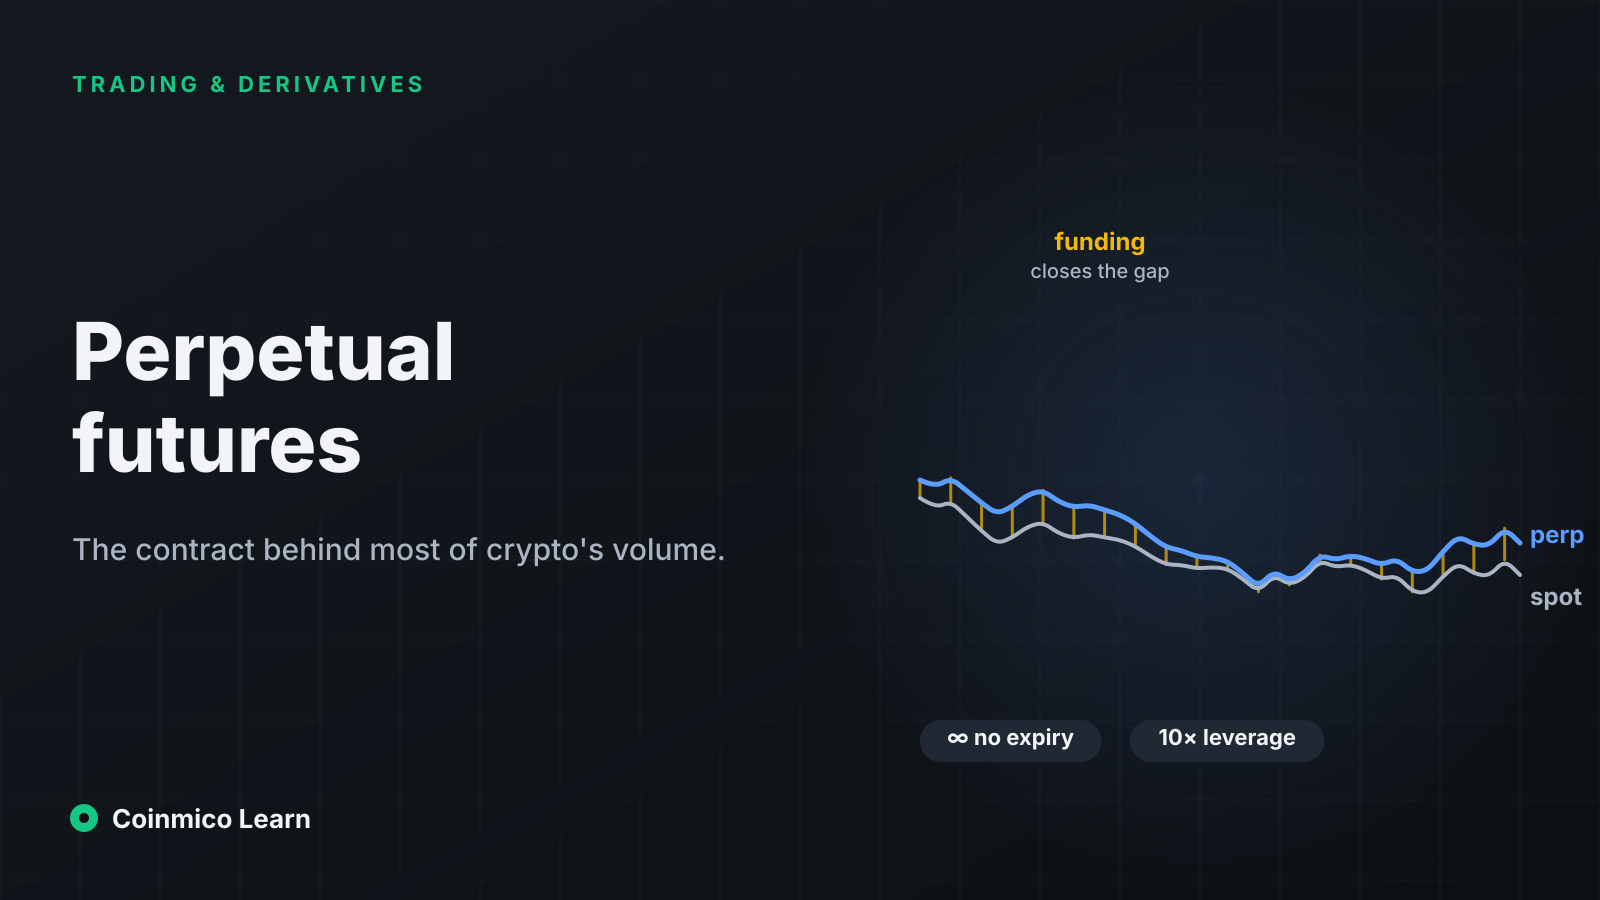
The perpetuals lesson introduced funding as the mechanism that ties a perp's price to spot: when the perp trades above spot, longs pay shorts; below, shorts pay longs. The funding rate is the size of that payment per period, expressed as a percentage of position notional.
Read it as the price of holding a position:
| Funding (per 8h) | Annualised | Reading |
|---|---|---|
| Around +0.01% | ~11% | Neutral. The default rate on most venues; slight long bias is normal. |
| +0.03% to +0.1% | 30–110% | Longs are crowded and paying heavily to stay in. |
| Above +0.1% | 100%+ | Extreme. Historically short-lived; usually resolves with a sharp drop. |
| Negative | — | Shorts are crowded and paying. Common at capitulation lows. |
Funding is best read across venues and over time. One exchange's rate can be skewed by a single large account; a rate that is elevated on every major venue for several days is the market as a whole leaning one way. Coinmico records funding on every perp venue it covers and shows the per-venue rates and their aggregate in a coin's derivatives panel.
Funding as a contrarian signal
High positive funding is not bearish because longs are "wrong". It is bearish because it is expensive. A trader paying 0.1% every eight hours needs the price to rise about 0.3% a day just to stay flat. The moment the price stalls, the cost forces the weakest longs to close, and their selling starts the move that liquidates the next tier. Extreme funding is the market pre-loading its own reversal.
The mirror image at lows: deeply negative funding means shorts are paying, and a small bounce forces them to buy back. Some of the sharpest rallies begin as short squeezes from negative funding.
Open interest
Open interest (OI) is the total notional value of all perpetual positions currently open on a venue. Every position has a long and a short side; OI counts each contract once.
OI is not volume. Volume measures how much traded in a day; OI measures how much is still open. A day of frantic trading where every position was closed by evening leaves volume high and OI unchanged.
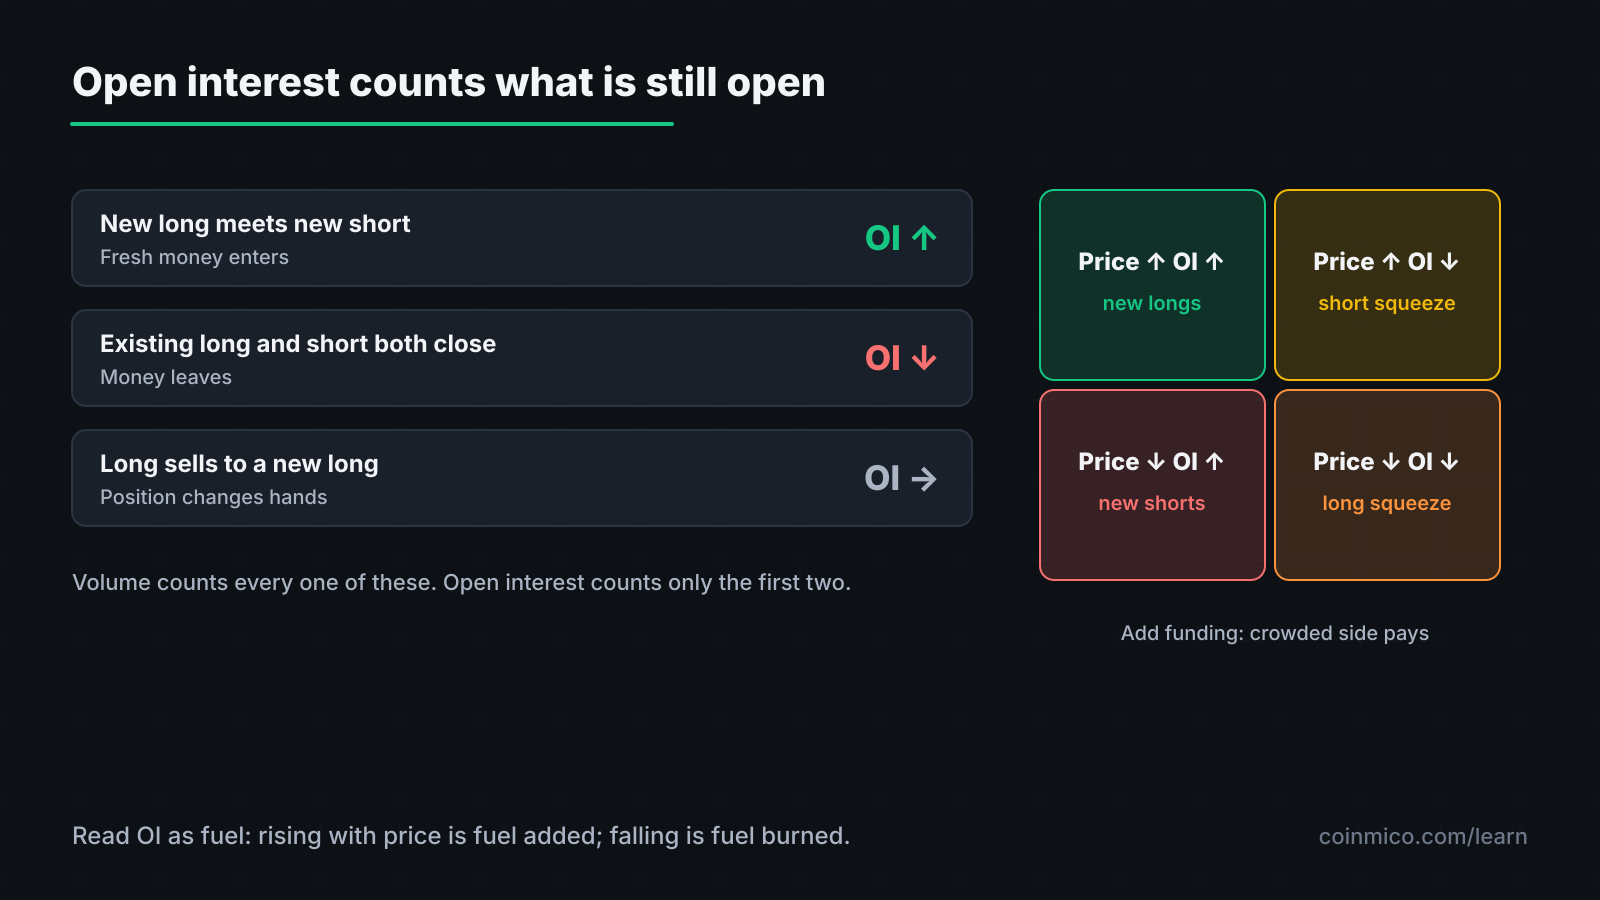
OI changes only when:
- A new long and a new short meet: OI rises. Fresh money has entered.
- An existing long and an existing short both close: OI falls. Money has left.
- A position changes hands (one long sells to a new long): OI unchanged.
Coinmico measures OI on each venue it covers and reports the total and per-venue figures on the derivatives exchanges page and on coin pages.
Reading price, OI and funding together
The value of OI is entirely in combination with price. Four cases:
| Price | Open interest | What is happening |
|---|---|---|
| Rising | Rising | New longs are opening. A trend with fresh money behind it — and leverage building. |
| Rising | Falling | Shorts are closing (buying back). A **short squeeze**: the move ends when the shorts are gone. |
| Falling | Rising | New shorts are opening. A trend with fresh money — check funding to see if they are crowded. |
| Falling | Falling | Longs are closing or being liquidated. A **long squeeze** or **deleveraging**. |
Add funding as the third dimension. Rising price, rising OI and rising funding is the classic late-stage pattern: new leveraged longs paying an increasing premium. Rising price with falling OI and negative funding is shorts being squeezed, which can be violent but is self-limiting.
OI relative to market cap
Raw OI numbers mean little without scale. Divide OI by the coin's market cap. For bitcoin the ratio is usually low single digits of a percent. For a small coin, OI above 10–20% of its cap means the derivatives market is larger than any realistic spot depth — the price is being set by leveraged positions, and liquidations in either direction will overwhelm the spot book.
A worked reading
Suppose a coin has risen 15% in three days. Three scenarios with identical charts:
- OI up 40%, funding +0.08%. New leveraged longs chased the move. Any pause is expensive for them. Fragile.
- OI down 20%, funding turned from negative to zero. Shorts were squeezed out. The fuel is spent; the move needs new buyers to continue.
- OI flat, funding neutral, spot volume up. The move was in spot. No leverage to unwind. The most durable of the three.
The chart alone could not distinguish them. Two numbers did.
Where the data is
Coinmico records funding rates and open interest from each perpetual venue it covers on a fixed schedule, and derives 24-hour liquidation totals from the same feeds. The derivatives panel on a coin's page shows all three with a per-venue breakdown; the derivatives exchanges page ranks venues by OI and measured volume.
 BitcoinBTCAcross 50 spot markets we index
What this means in practice
- Check funding before entering a trend. If you are joining the crowded side, you are paying for the privilege and standing where the cascade will start.
- Read OI as fuel: rising OI with price is fuel being added; falling OI is fuel being burned.
- Scale OI to market cap. The same dollar figure is background noise on bitcoin and a controlling force on a small cap.
Next in this track
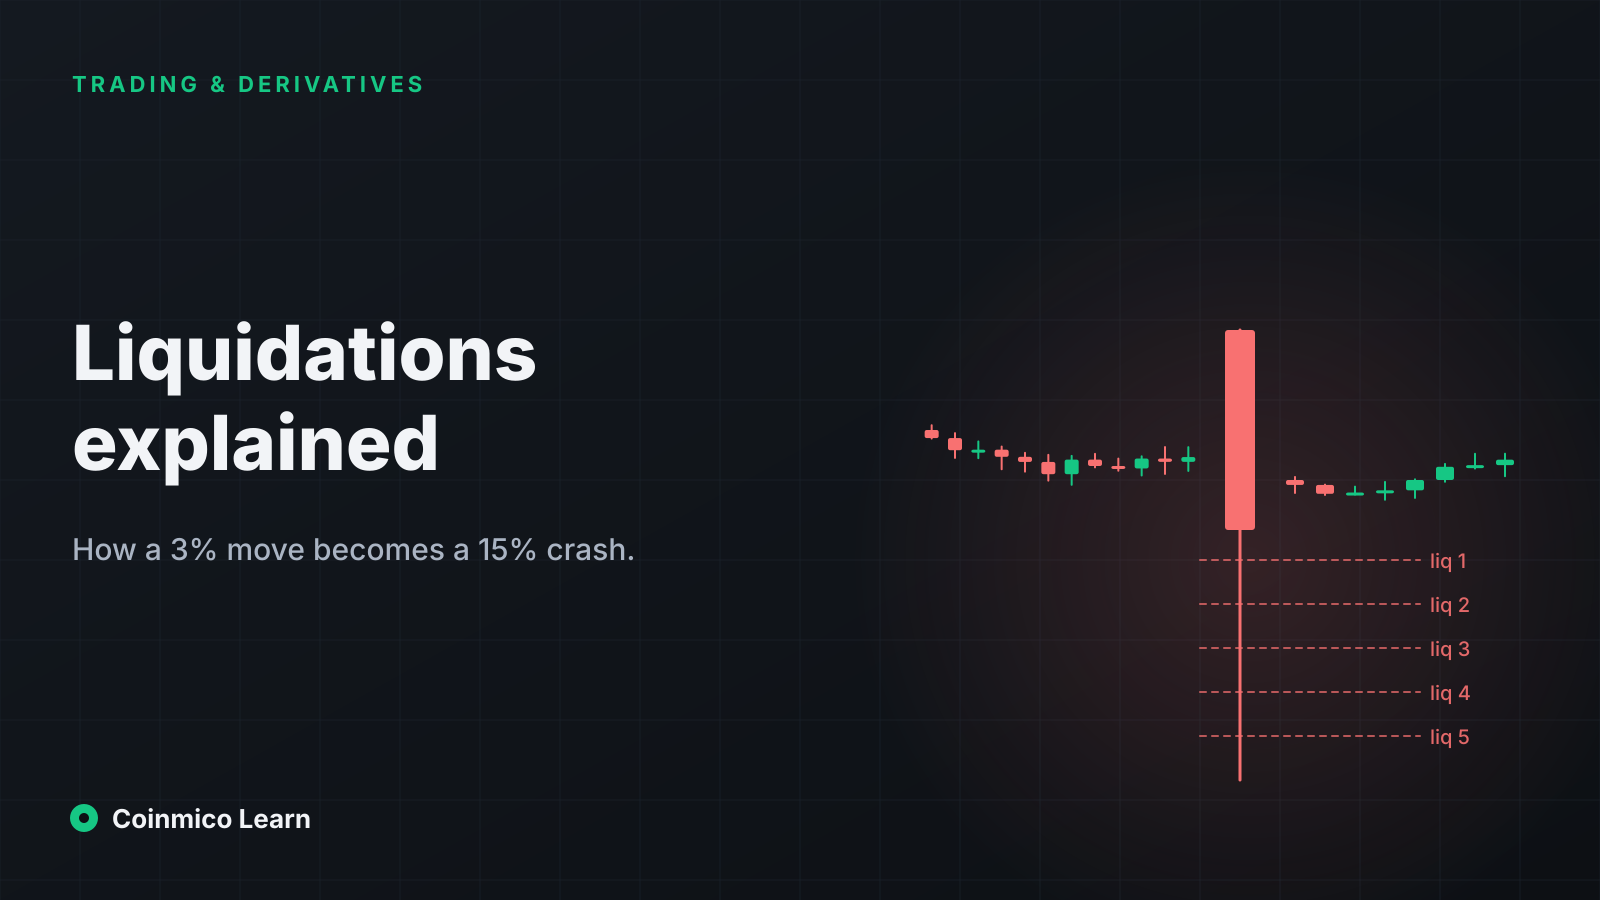
When crowded positions unwind, the mechanism is liquidation. The next lesson follows a cascade step by step and shows how to read liquidation data.
Assets in this piece
 Bitcoin
 Ethereum
Every figure here is measured by Coinmico across the venues and chains we index. See our methodology.