Best time to trade crypto: volume by hour and day
Crypto trades around the clock, but activity does not. Coinmico measurements show when centralized-exchange volume and Bitcoin's hourly moves have tended to cluster.
What You Will Learn
- "Over eight weeks to 8 November 2026, 13:00–16:00 UTC was the busiest three-hour window on centralized exchanges."
- "The quietest UTC-hour buckets each accounted for about 3.0% of total measured CEX volume across the 56-day window; the busiest hour was also the most volatile."
- "Weekend median volume was about 41% below the weekday median in Coinmico's eight-week sample."
Crypto markets never close, but activity is not evenly spread across the clock. A trade can meet a deep book in one hour and a thin book a few hours later. That difference affects how quickly an order fills and how far its execution price can move.
There is no universally best time to trade. The right time depends on what you value: available liquidity, a calmer market, or access to a particular venue. Coinmico measured centralized-exchange (CEX) trading over eight full weeks, from 13 September to 8 November 2026, to make those trade-offs easier to see.
What Coinmico measured
The hourly and weekday figures below combine spot and derivatives volume from centralized exchanges. They do not include decentralized exchanges (DEXs). Each hourly share is that UTC hour's portion of all measured CEX volume across the full 56-day window; weekday medians compare the typical daily total in the sample. They are a dated snapshot, not a forecast or a schedule that every venue must follow.
Coinmico also compared the mean absolute one-hour move in its Bitcoin index by UTC hour. This is a measure of how much the index moved, without treating upward and downward moves as canceling each other out. The same eight-week window supplied both the volume and Bitcoin movement readings.
The busiest and quietest hours
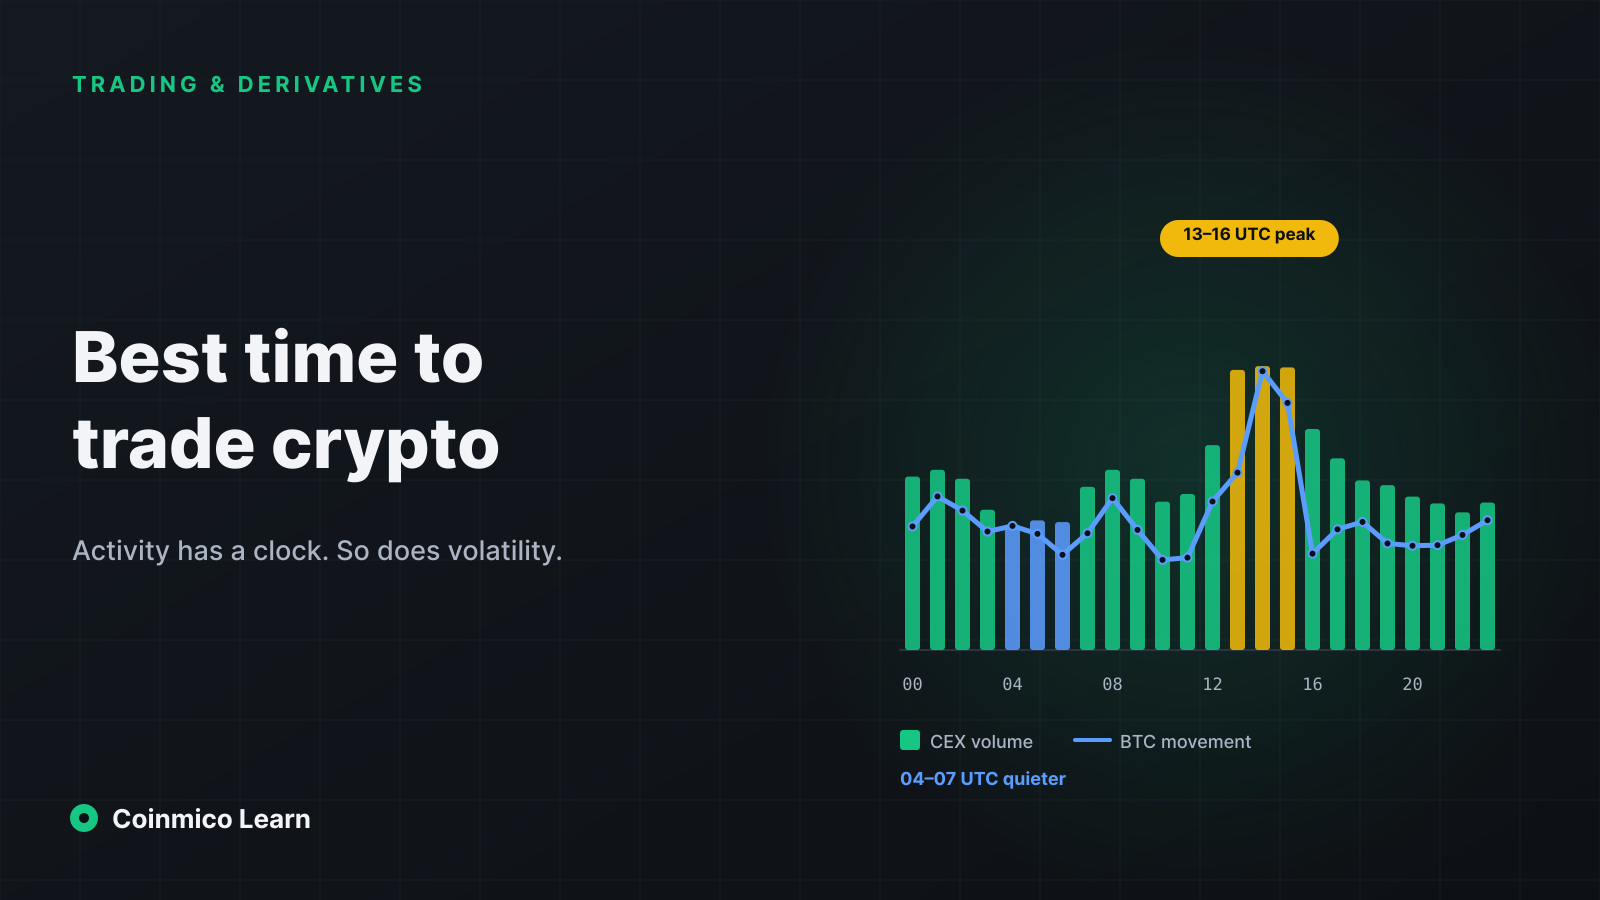
The measured peak was 13:00–16:00 UTC: the three hourly buckets from 13:00 through 15:59 accounted for 19.9% of total CEX volume measured across the 56-day window. The single busiest bucket was 14:00 UTC, at 6.68% of that total. For most of the sample, the United States was on Eastern Daylight Time, and the US stock-market open fell at 13:30 UTC. That overlap is a useful time-zone reference, not proof that one market alone caused the peak.
The quietest stretch was 04:00–07:00 UTC, meaning 04:00 through 06:59. Each of those hourly buckets accounted for about 3.0% of total CEX volume measured across the window. The 14:00 hour had about 2.3 times the volume share of the quietest hour, 04:00.
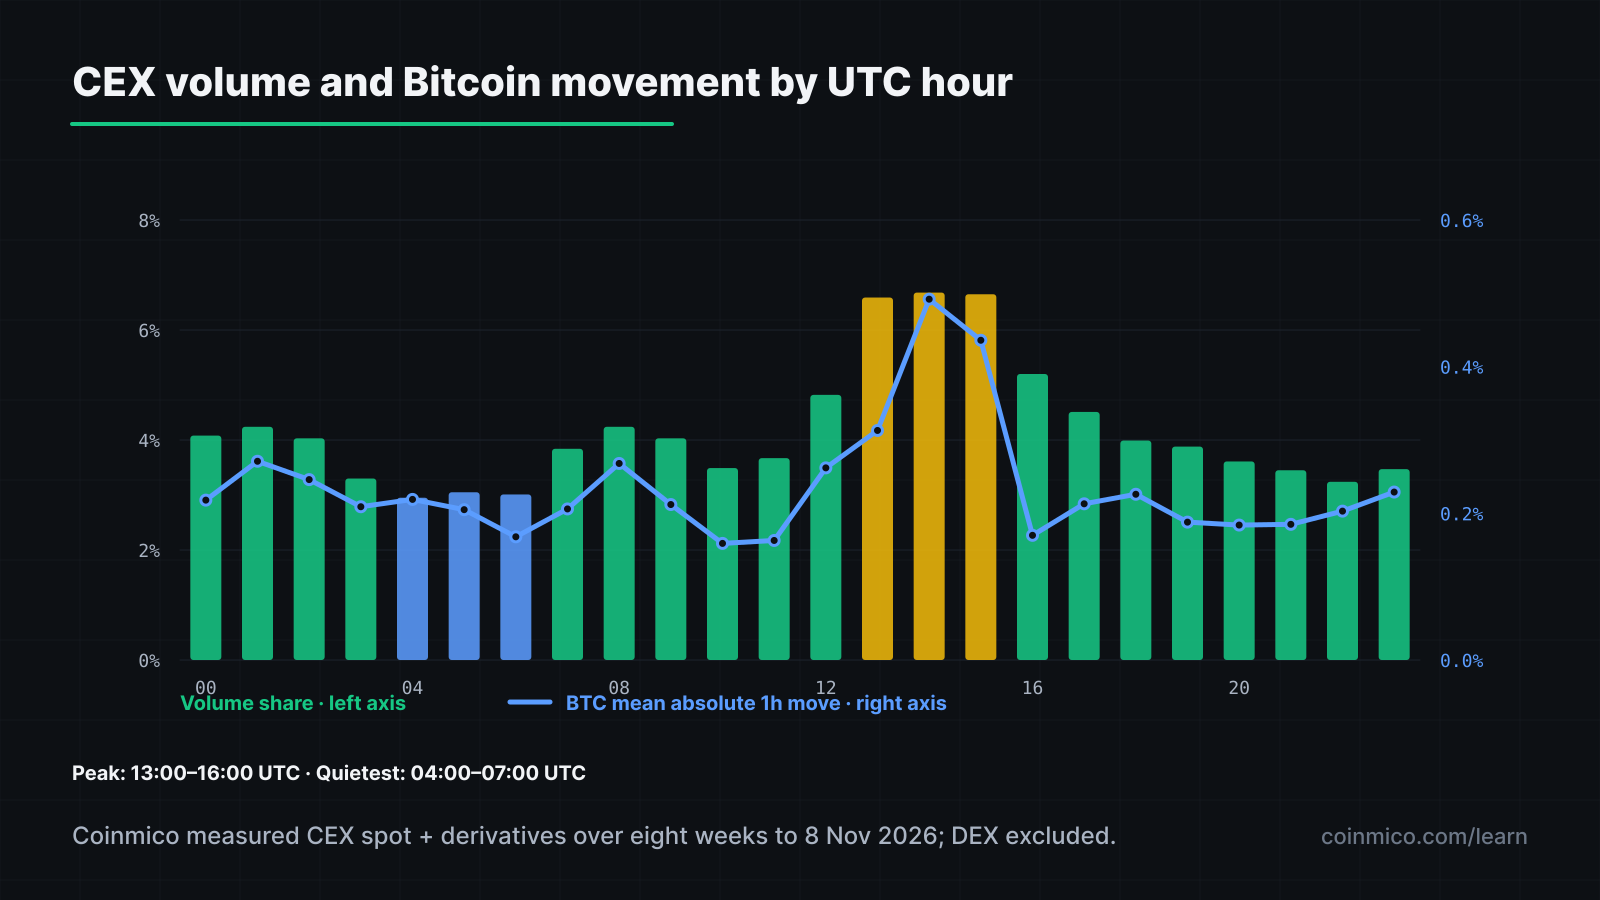
_Measured by Coinmico over eight weeks to 8 November 2026. CEX spot and derivatives are combined; DEX volume is excluded. Volume share is shown on the left axis and mean absolute Bitcoin index movement on the right._
Volume and volatility rise together in the peak
The busiest hours were also the most volatile in this sample. At 14:00 UTC, Bitcoin's mean absolute one-hour index move was 0.492%. By comparison, the 10:00 and 11:00 hours averaged about 0.16%. The peak hour's average move was roughly three times those quieter readings.
More activity can mean more orders and a better chance of finding a counterparty. It does not mean prices will be calm. News, changing expectations, and competing orders can make the most active hours move quickly. Conversely, the low-volume hours had smaller average Bitcoin moves in this sample, but a thin order book can still react sharply to a large order.
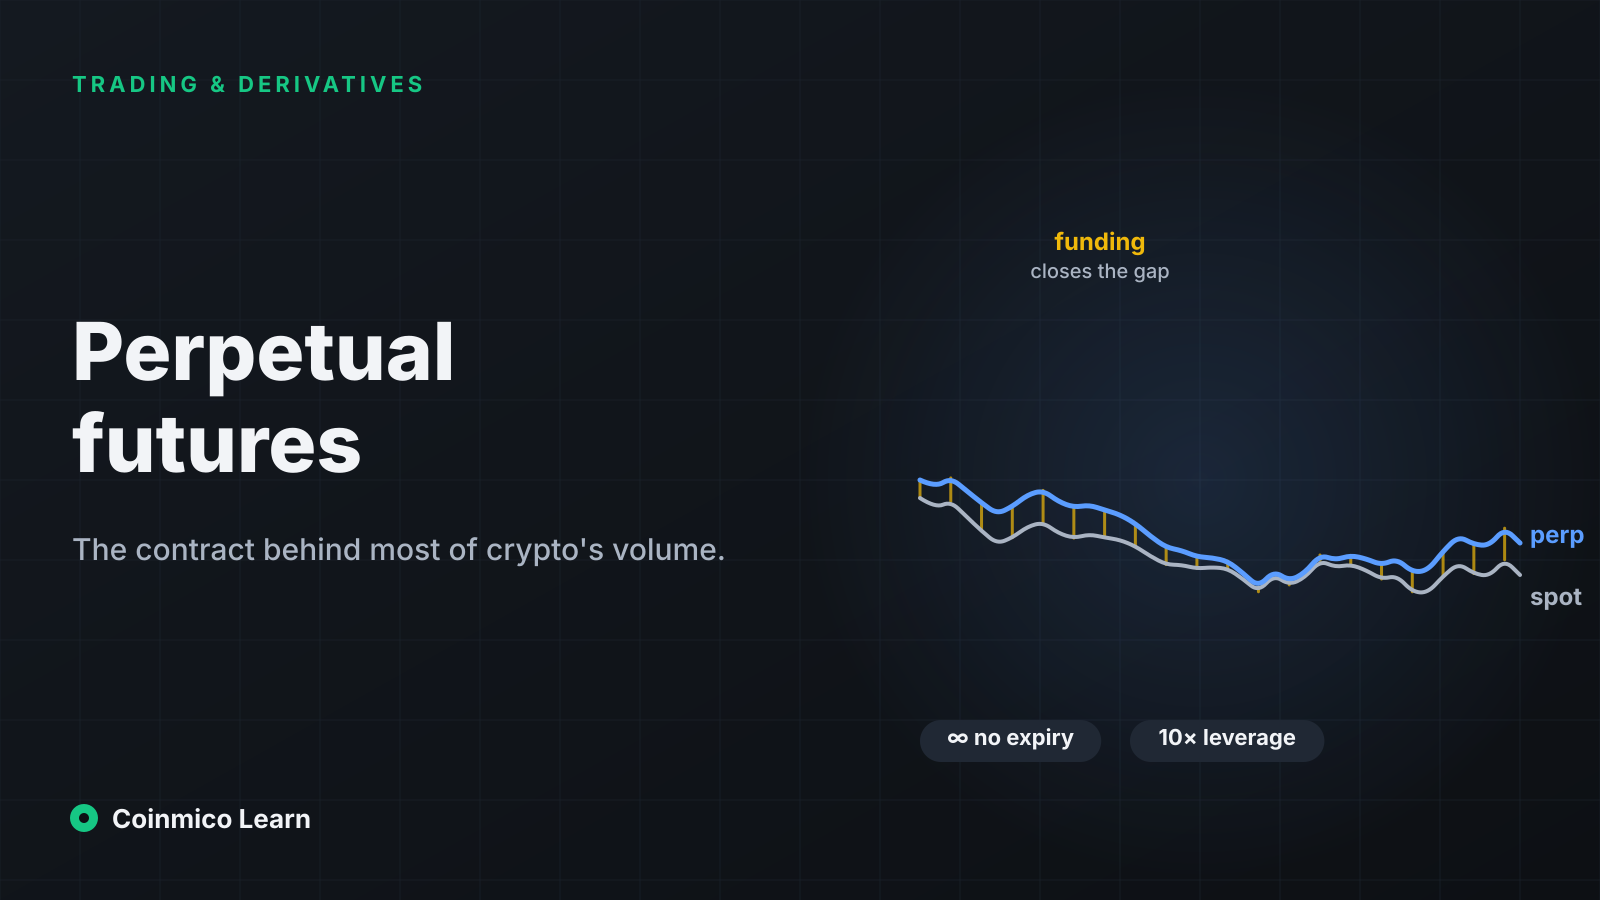
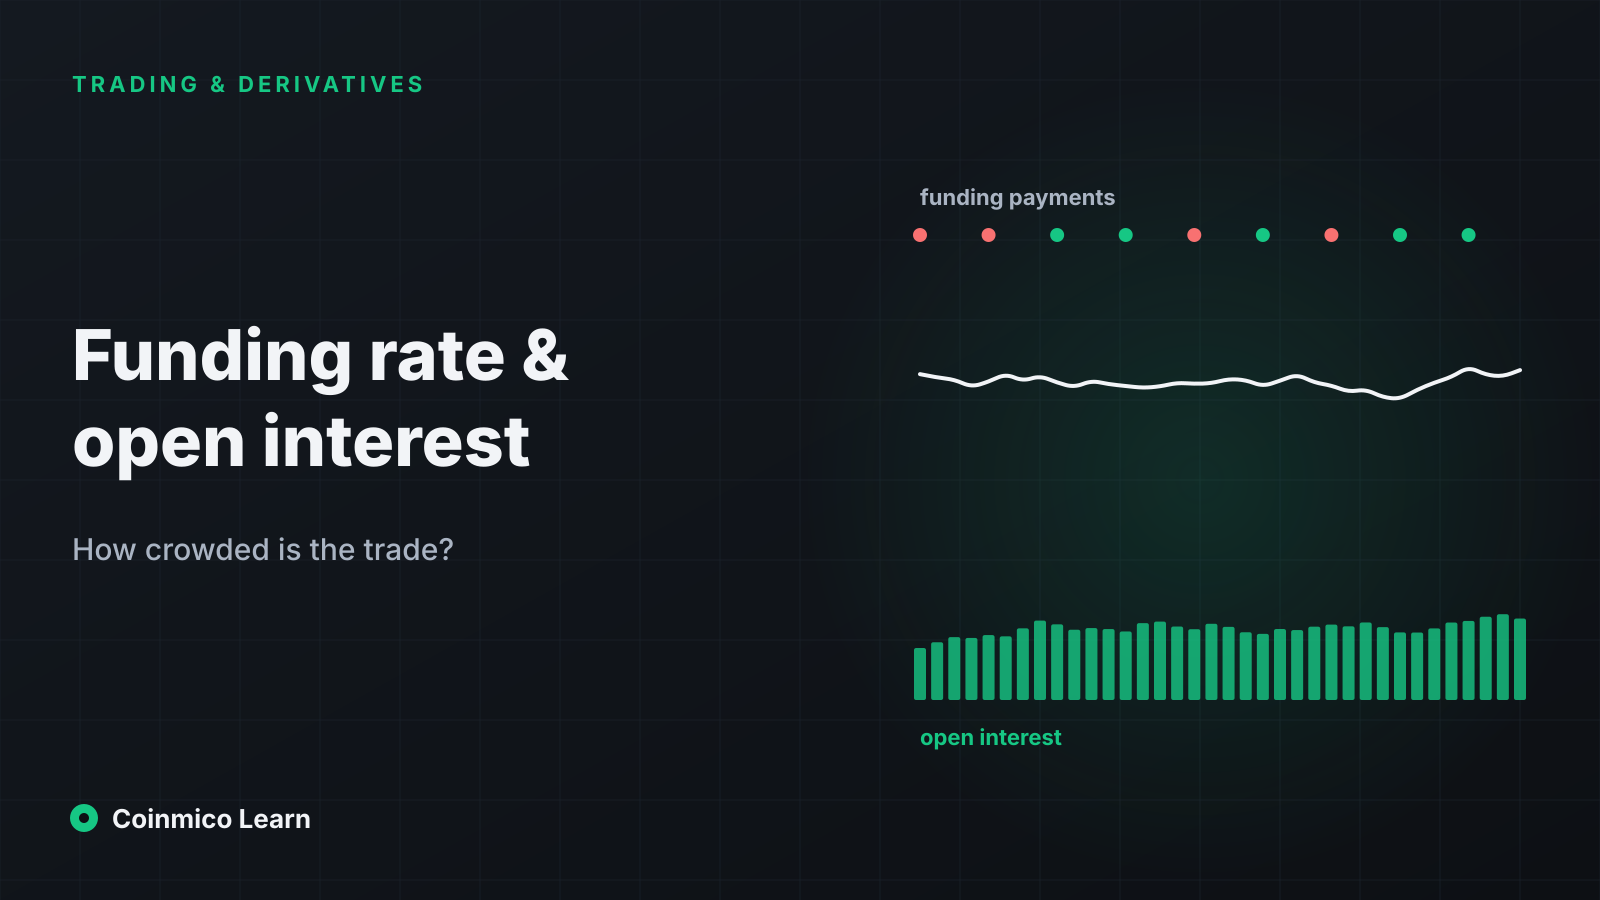
For an introduction to reading the volume behind a move, see How to Read Trading Volume. For the difference between spot and perpetual markets, continue with What Is a Perpetual Futures Contract? and Funding Rate and Open Interest.
How activity changes by day
Coinmico measured the following median daily CEX volumes, with eight days contributing to each weekday's median:
| UTC day | Median CEX volume |
|---|---|
| Monday | $129.6B |
| Tuesday | $122.4B |
| Wednesday | $147.0B |
| Thursday | $166.6B |
| Friday | $129.6B |
| Saturday | $73.5B |
| Sunday | $85.4B |
The median weekday was $131.2B, compared with $77.6B for the weekend. That is about 41% lower on weekends. Saturday was the quietest day in the sample; Sunday was somewhat busier, with activity beginning to pick up as Asia moved into Monday morning around 23:00–00:00 UTC.
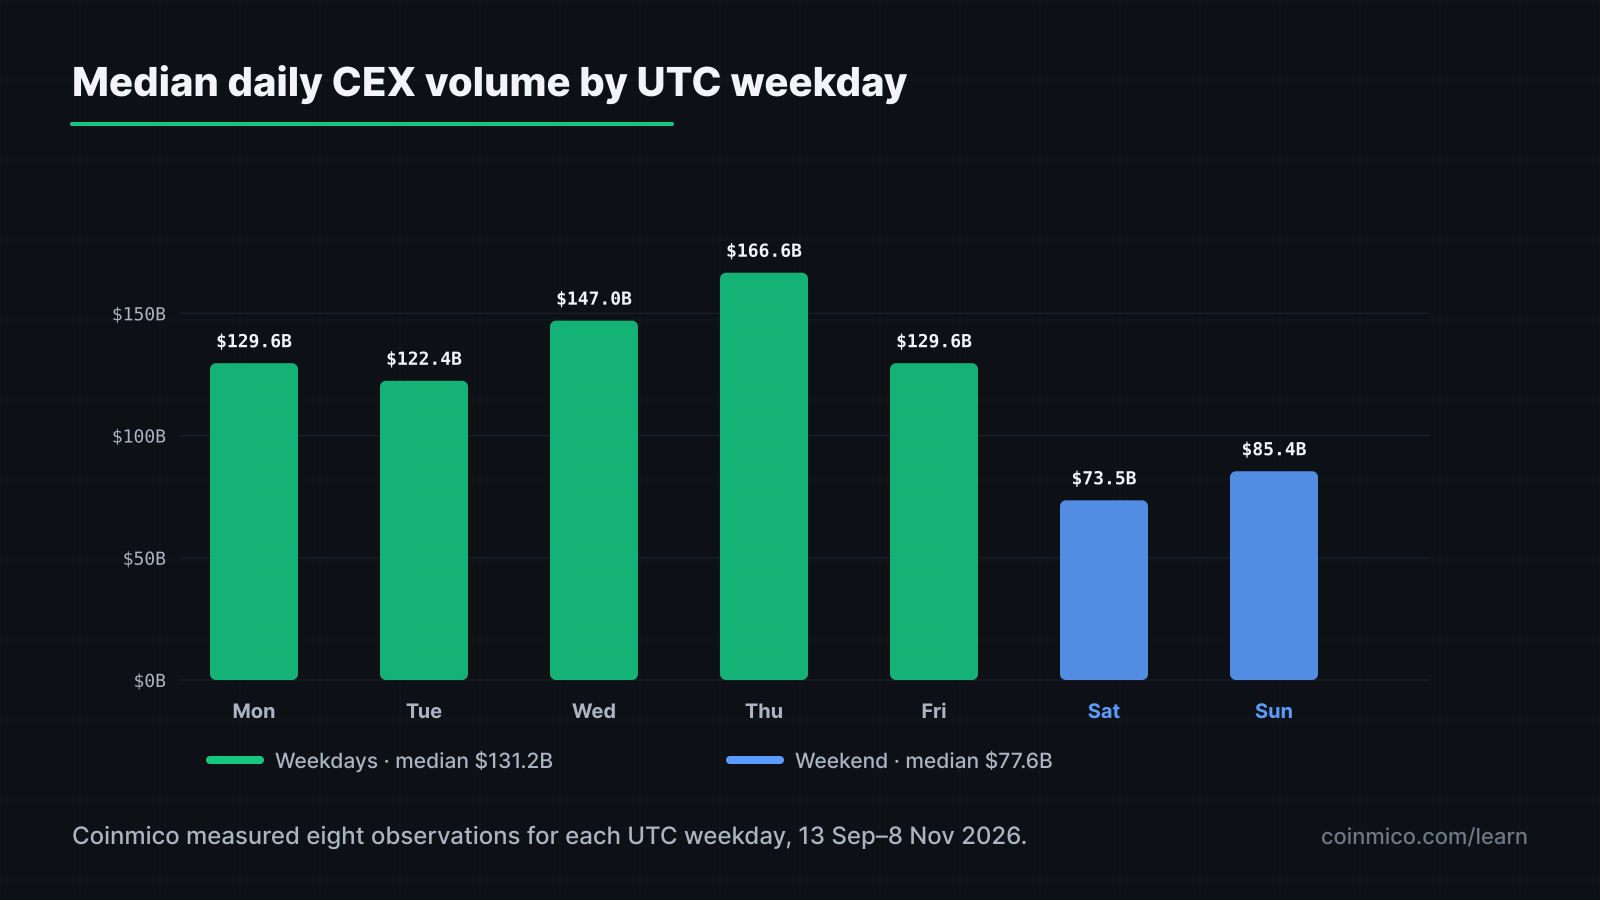
_Median daily CEX spot and derivatives volume, measured by Coinmico over eight weeks to 8 November 2026. Each weekday has eight observations._
The weekday pattern is a summary of this particular window, not a promise about the next Saturday or Thursday. An event can make a normally quiet session unusually active. The separate guide to crypto weekend trading explains why lower average activity does not remove trading risk.
Convert UTC to your local clock
The table uses the measured peak and trough windows. End times are exclusive: for example, 13:00–16:00 UTC covers 13:00 through 15:59. New York and London switch between daylight and standard time, so their local equivalents depend on the date. The United States was on EDT for most of Coinmico's measurement window; the final days followed the US switch to EST. London changed from BST to GMT during the window.
| Window | New York | London | Jakarta (WIB) | Seoul (KST) | Istanbul (TRT) |
|---|---|---|---|---|---|
| Peak, 13:00–16:00 UTC | 09:00–12:00 EDT for most of the window; 08:00–11:00 EST after the US change | 14:00–17:00 BST before the UK change; 13:00–16:00 GMT after | 20:00–23:00 | 22:00–01:00 next day | 16:00–19:00 |
| Quiet, 04:00–07:00 UTC | 00:00–03:00 EDT for most of the window; 23:00–02:00 EST after the US change | 05:00–08:00 BST before the UK change; 04:00–07:00 GMT after | 11:00–14:00 | 13:00–16:00 | 07:00–10:00 |
Use UTC as the stable reference and convert for the date you plan to trade. Local market schedules and daylight-saving changes can shift, even though the UTC measurement itself does not.
Liquidity, spreads, and price impact are different
Volume is the amount traded over a period. Liquidity is how much can be bought or sold near the current price without moving it much. The bid-ask spread is the gap between the best available buy and sell quotes. Price impact is the change in execution price caused by your order consuming available depth.
These ideas are related, but they are not interchangeable. Higher aggregate volume can coincide with deeper books and more counterparties, yet a crowded or fast-moving market can still have a wide spread. A low-volume period can have a narrow spread on one pair and little depth just beyond the best quote. A single volume number cannot tell you the exact cost of your order.
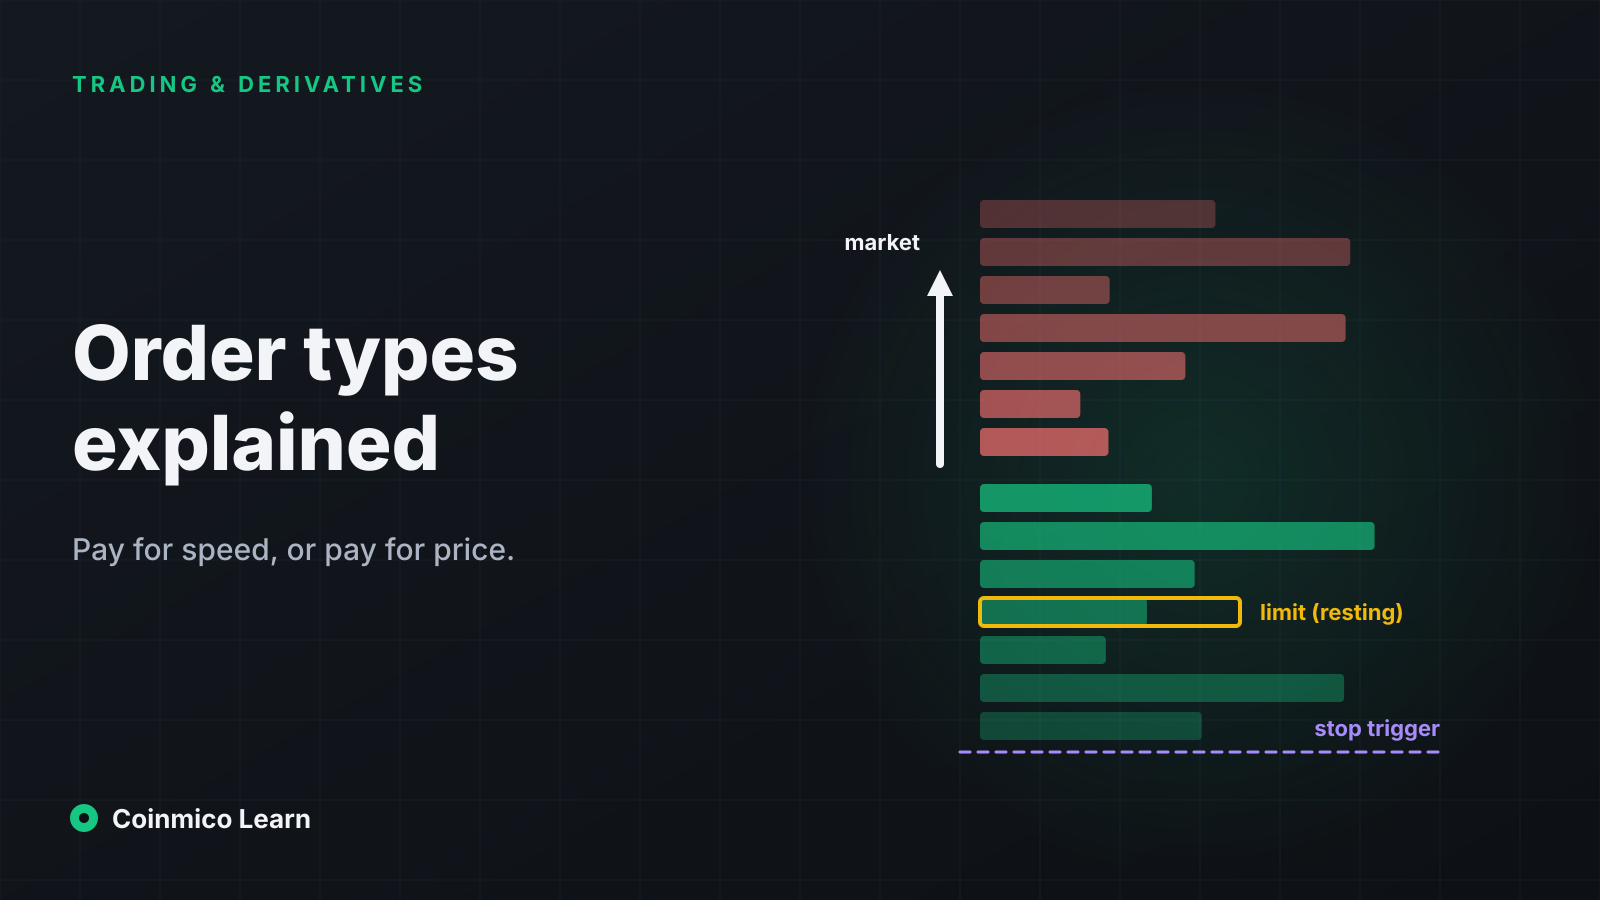
Before sending an order, look at the specific pair and venue, not just the market-wide clock. Compare the amount available at several price levels with the size you intend to trade. If an order is large relative to visible depth, splitting it or using a limit order can help control the price you accept. A limit order may not fill, so the trade-off is execution certainty versus price control; order types explained covers that choice.
What this means in practice
- For a large order: start by checking depth during the measured peak, when more CEX activity was present. Peak hours also had the largest average Bitcoin moves, so use a plan for price limits rather than assuming high volume guarantees a quiet fill.
- To avoid some of the busiest swings: compare the quieter hours with the instrument and venue you actually use. Coinmico's sample had lower average Bitcoin movement around the 10:00–11:00 UTC hours, but lower activity can also mean less depth. It is not a guarantee against a sudden move.
- When price matters more than speed: consider a limit order and decide in advance what price would make you walk away. Check the order book and spread again before submitting; the time-of-day pattern is only a broad guide.
- For weekend trades: treat lower aggregate volume as a reason to inspect depth more carefully, not as evidence that every pair is safe or inactive.
Coinmico's Bitcoin price methodology explains how the index brings measured venue prices together. To compare venues directly, see Exchanges and the Bitcoin market page.
Next in this track
With timing in mind, the next lesson moves to an instrument used for around-the-clock trading and explains how it differs from spot.
Every figure here is measured by Coinmico across the venues and chains we index. See our methodology.