Crypto weekend trading: what changes when markets stay open
Crypto trades all week, but centralized-exchange activity and Bitcoin's average moves were lower on weekends in Coinmico's eight-week sample. Thin books still matter.
What You Will Learn
- "Coinmico measured weekend median CEX volume about 41% below the weekday median over eight weeks to 8 November 2026."
- "Saturday was the quietest day in the sample, while Sunday activity picked up toward Asia's Monday morning."
- "Average volatility was lower on weekends, but thinner order books can make price impact per dollar larger."
Crypto markets do not close for the weekend. Spot exchanges and crypto derivatives continue to trade, while some traditional market sessions pause. That can make the weekend feel unusually quiet, but a quiet market is not automatically an easy or safe market.
Coinmico measured centralized-exchange (CEX) spot and derivatives activity over eight full weeks, from 13 September to 8 November 2026. In that sample, weekend volume was lower and Bitcoin's average moves were smaller than on weekdays. There were only eight weekends in the window, so treat the figures as a snapshot of that period rather than a rule for every weekend.
Weekend volume was lower in the sample
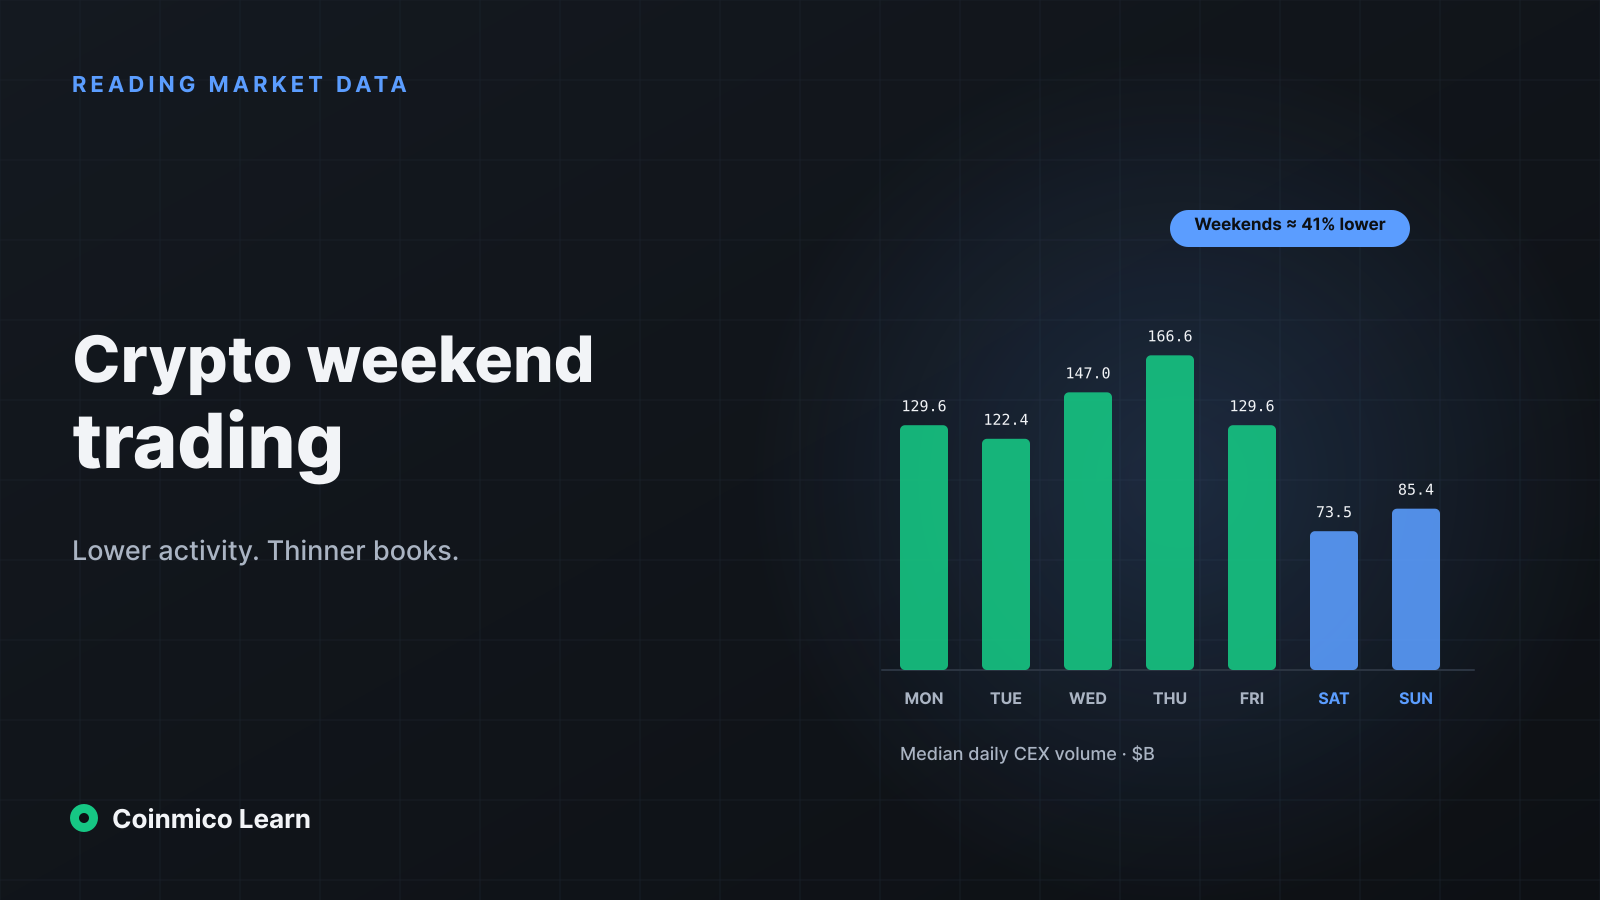
Coinmico's median CEX volume was $131.2B per weekday and $77.6B per weekend day, about 41% lower on weekends. Saturday was the quietest day, with a median of $73.5B across eight Saturdays. Sunday's median was $85.4B, higher than Saturday's, as activity began to pick up toward Asia's Monday morning around 23:00–00:00 UTC.
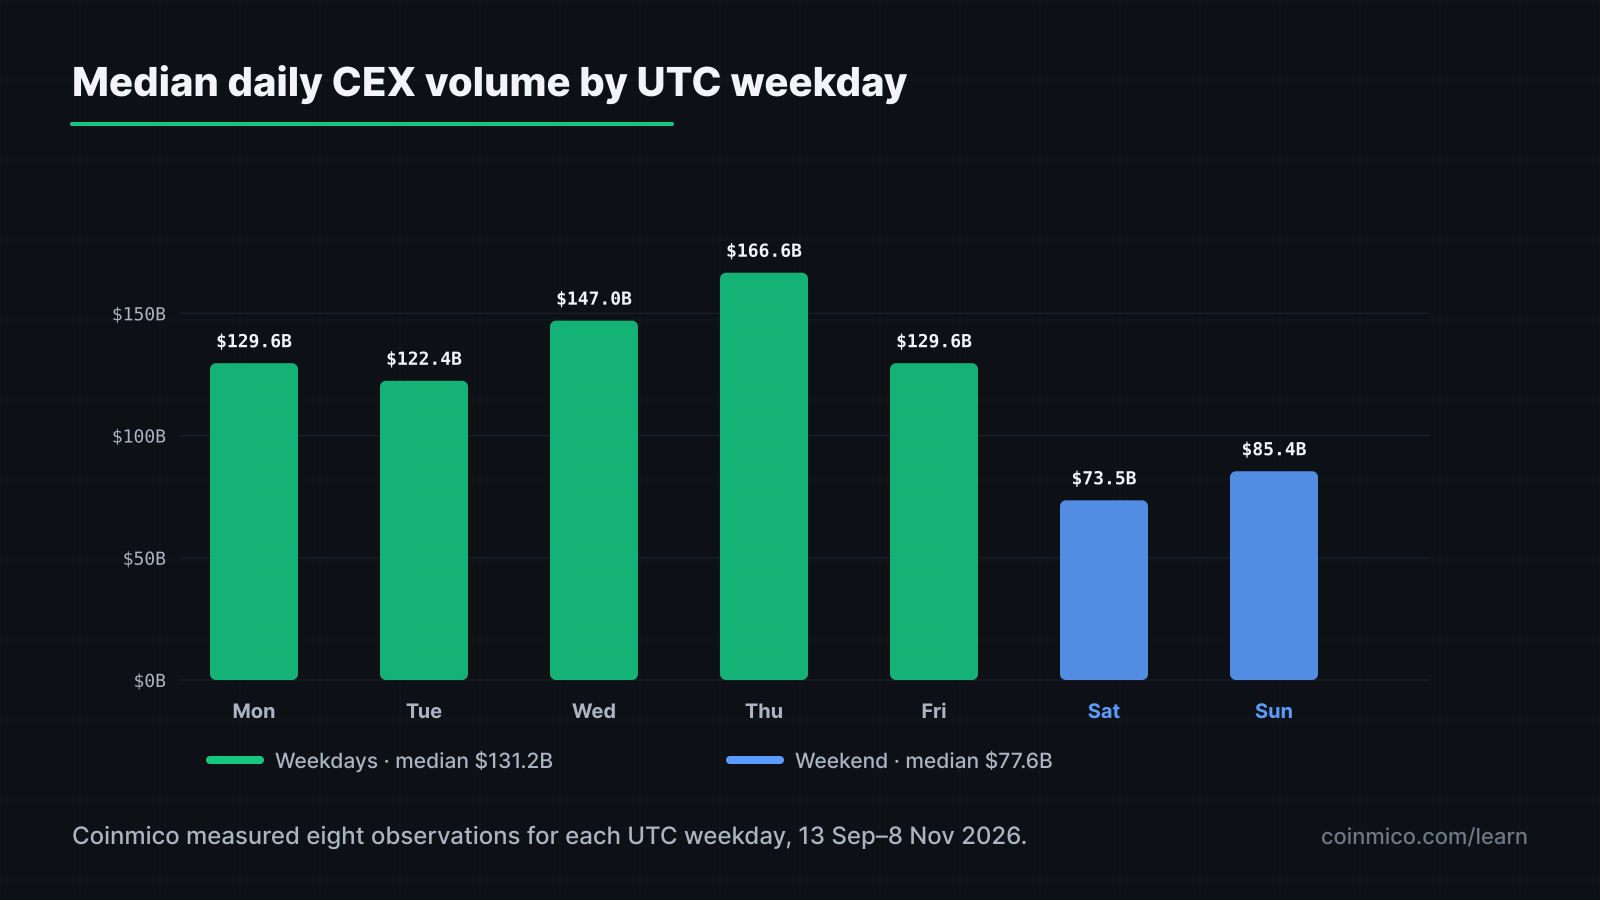
_Median daily CEX spot and derivatives volume, measured by Coinmico over eight weeks to 8 November 2026. DEX volume is excluded; each weekday has eight observations._
These are aggregate measurements across the CEX venues in the data, not a promise that every exchange or pair is quiet on Saturday. A single announcement, liquidation cascade, or other event can bring activity into a normally quieter session.
Lower average volatility does not mean lower risk
Coinmico's mean absolute Bitcoin one-hour index move averaged 0.273% on weekdays and 0.140% on weekends in the same sample. The average daily high-to-low Bitcoin range was 2.63% on weekdays, across 40 days, and 1.03% on weekends, across 16 days.
Those readings describe average movement during the measured window. They do not tell you how much the price will move when your order arrives. If fewer buyers and sellers are near the current price, a trade can consume more of the available book. That is price impact: the execution price changes as the order fills. A smaller average market move can coexist with a larger price impact for a particular order.
Volume and price impact are not the same measure. For a practical guide to volume, read How to Read Trading Volume. For spread, depth, and execution choices, see Order Types Explained.
Weekends and traditional market sessions
Some traditional products, including CME-listed futures and exchange-traded funds, have trading sessions that close for the weekend. Crypto markets can continue moving during that pause. When those traditional sessions reopen, their prices may reflect information and positioning that accumulated while they were closed. The difference between a previous close and the next opening price is often called a gap.
A gap is not a prediction that prices must move in one direction. It is a reminder that a reference price from a closed market may be stale while crypto continues to trade. Compare timestamps and use live market depth rather than treating the last traditional-session close as a current crypto quote.
Weekend trading also spans time zones. In Coinmico's sample, Sunday's volume rose somewhat as Asia approached Monday morning. That does not mean every venue opens or closes at a single global moment; crypto remains continuous, and regional participation varies.
How to read a weekend snapshot
A daily volume median describes how much traded in the sample; it does not show how much is waiting in the order book now. Volatility describes observed price movement over a period. Spread describes the gap between the best available bid and ask, while depth shows how much can trade near those prices. These measures answer different questions. A weekend can have lower average movement and still offer less nearby depth, so an order of the same size can move the price more.
Compare like with like before deciding whether a weekend market is unusually thin. Check the same asset, pair, venue, and time of day, then inspect the current bids and asks rather than relying on a broad market total. Aggregated CEX data can describe a market-wide pattern, but a specific BTC/USD order book may behave differently from another venue or a BTC/USDT pair. The quote currency, local funding routes, and the trades actually present all matter.
The weekly calendar can also make a chart look more certain than it is. A last price from a closed futures session is a reference, not an executable crypto price. Crypto can respond to news while that market is closed, and an opening gap only describes the difference between two recorded prices. It does not say which side should trade next or whether the opening price will remain available. Compare the timestamps, then reassess once the relevant market is open.
Finally, treat the Sunday transition as a changing session, not a switch that happens everywhere at once. Coinmico observed activity rising toward Asia's Monday morning, but that aggregate pattern cannot tell you how much depth a particular venue will show when you place an order. Watch the pair you intend to trade, and be ready for liquidity and spreads to change as participants enter the market.
What this means in practice
Before acting, decide whether you are entering, reducing, or maintaining a position; the same thin book creates different costs for each. If you can wait, a limit order can bound your execution price, but a fill is not assured. If you need to exit promptly, estimate the trade against current depth and allow for worse execution than a displayed last price. Average volatility does not cap event-driven moves, and a stop order does not make a thin market deep. Recheck the book when you send the order rather than assuming it matches the last chart candle.
These checks matter whether you trade actively or simply need to rebalance or sell. The point is not to avoid every weekend session; it is to account for the market that is actually available. A weekday median, a futures close, or an earlier quote cannot tell you the price and quantity you can trade now. Use them as context, then make the decision from current bids, asks, and depth on the venue you plan to use.
- Before a larger order: inspect the order book on the exact venue and pair. Lower aggregate weekend volume can mean less nearby depth, so a market order may have more impact than expected.
- If you want price control: a limit order can set the price you will accept, but it may not fill. Decide whether waiting is preferable to crossing a thin spread; order types explained compares the trade-offs.
- When traditional markets are closed: note which reference prices are stale and when those sessions reopen. Crypto can move while futures and ETFs are not trading.
- On Sunday: activity may begin to rise toward Asia's Monday morning, but do not assume the transition will be smooth or that every pair will follow the aggregate pattern.
- Keep the sample in view: eight weekends can show a pattern, not all possible weekend conditions. A lower average range is not a guarantee against a sharp move.
For hourly activity and time-zone conversions, read Best Time to Trade Crypto. When a Bitcoin price differs across venues, compare the quote currency and timestamp with Why Bitcoin's Price Differs Between Exchanges. Coinmico's price methodology describes the index used for these measurements.
Next in this track
Continue with How to read a crypto market recap: a real example to see how these measurements fit together in a daily market snapshot.
Every figure here is measured by Coinmico across the venues and chains we index. See our methodology.