The Fear & Greed index: what it measures and how Coinmico calculates it
Sentiment indices are easy to quote and hard to trust, because most of them mix survey answers and social-media counts nobody can check. Coinmico's version uses market data only. This lesson opens the box.
What you will learn
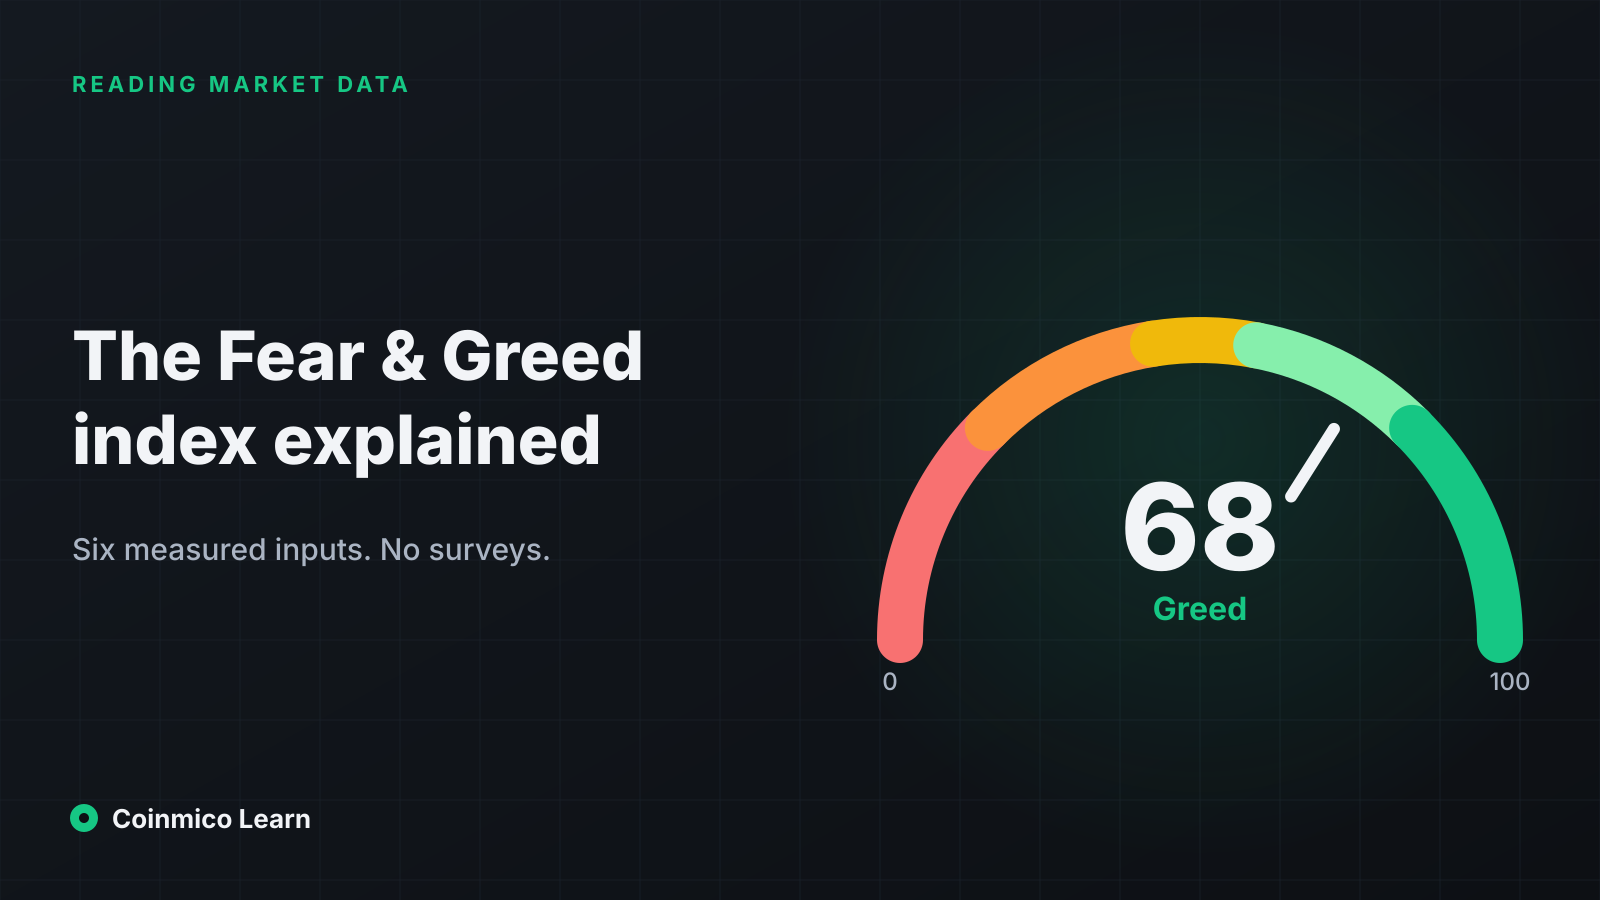
- Fear & Greed compresses several market measurements into one 0–100 score. Extreme readings mark crowded positioning, not turning points on their own.
- Coinmico's index uses six components — momentum, volatility, breadth, turnover, dominance and altcoin momentum — every one computed from prices and volumes we measured ourselves.
- The score is most useful at its extremes and in its rate of change; a jump from 30 to 70 in a week says more than a steady 60.
Most crypto Fear & Greed indices are black boxes: a blend of volatility, volume, social-media chatter, survey results and search trends, weighted by rules that are described in a paragraph and cannot be reproduced. Coinmico built its own so that every reading traces back to trades we recorded. This lesson explains the idea of a sentiment index, then the specific one you see on this site.
What a sentiment index tries to capture
Markets overshoot. When prices have risen fast, participants become confident, leverage builds, and every dip is bought. When prices have fallen fast, the same people become fearful, sell into weakness and stop buying. A sentiment index is an attempt to measure where the crowd is on that cycle.
The premise, borrowed from decades of equity-market indicators, is that extreme sentiment is a contrarian signal: when almost everyone is greedy there are few buyers left, and when almost everyone is fearful there are few sellers left. That is a tendency, not a law — greed can persist for months in a strong trend.
Coinmico's six components
Every component is scored from 0 (fear) to 100 (greed), then combined with the weights below. Nothing is surveyed, scraped or borrowed from another index.
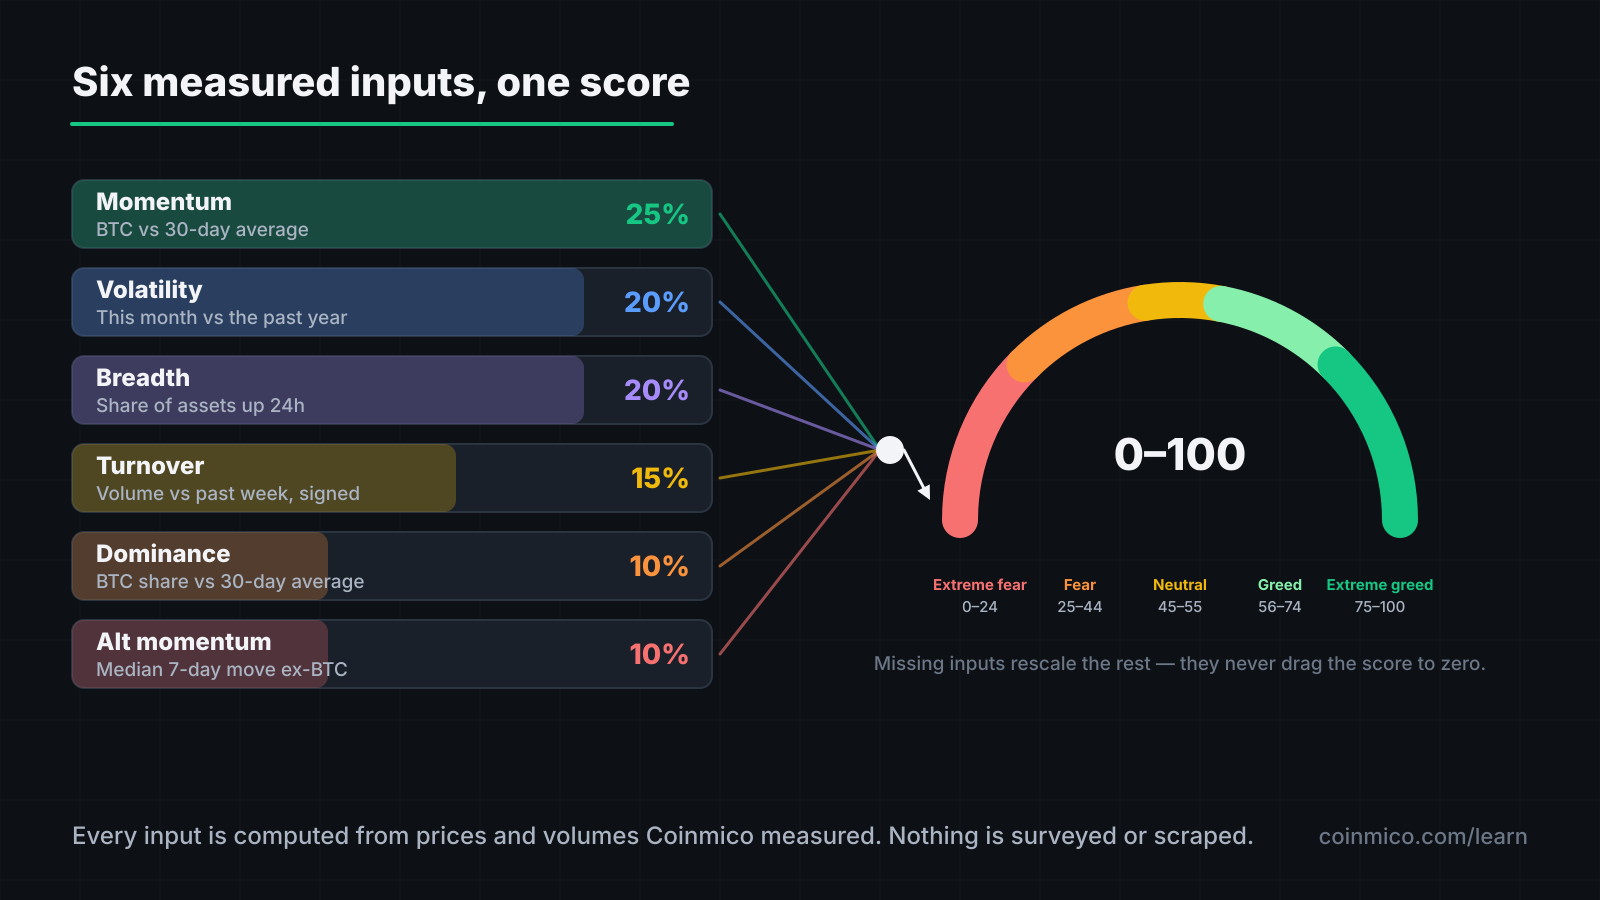
| Component | Weight | What it measures |
|---|---|---|
| Momentum | 25% | How far bitcoin trades above or below its own 30-day average. Well above reads as greed. |
| Volatility | 20% | The last month's realised volatility ranked against the past year. Calm advances read as confidence; violent moves in either direction read as fear. |
| Breadth | 20% | The share of assets in the basket that are up over 24 hours. A rally only a few coins join scores low. |
| Turnover | 15% | Trading volume against the past week, signed by direction: heavy volume into a rise is greed, the same volume into a fall is fear. |
| Dominance | 10% | Bitcoin dominance against its 30-day average. Money crowding into bitcoin is money leaving risk, so rising dominance scores towards fear. |
| Altcoin momentum | 10% | The median 7-day move of the market outside bitcoin. The median rather than the average, so one outlier cannot swing it. |
If a component cannot be computed on a given day — for example, the volatility window is not yet full for a newly indexed period — the remaining weights are rescaled to sum to one. A missing input widens the uncertainty rather than dragging the score towards zero.
The labels
| Score | Label |
|---|---|
| 0–24 | Extreme fear |
| 25–44 | Fear |
| 45–55 | Neutral |
| 56–74 | Greed |
| 75–100 | Extreme greed |
The current reading, each component's contribution, and the history are on the Fear & Greed page. Because the same arithmetic is run on stored daily data, the "yesterday" and "last week" figures are recomputed rather than looked up — a method change applies to the whole history at once, and old readings never silently mean something different from new ones.
Why market data only
Social-media volume and survey sentiment feel like they should be good inputs, and they are terrible ones. Bot activity, coordinated campaigns and platform algorithm changes move them for reasons unrelated to the market. Search interest spikes on crashes and on rallies alike. None of it can be checked after the fact.
Prices, volumes and market caps have the opposite properties. They are measured from trades that happened, they cannot be inflated without spending real money, and anyone with the same trade history can recompute the score. Coinmico's index gives up some colour in exchange for that.
How to read it
Extremes matter, the middle does not. A reading of 52 versus 58 is noise. A reading above 80 or below 20 is a statement about positioning: most of the market is leaning the same way.
Rate of change matters. Sentiment that flips from Fear to Greed in a week reflects a sharp move that has pulled in fast money. That money leaves as quickly as it arrived. Sentiment that drifts up over two months reflects a trend with steadier participation.
Check what drove it. The component breakdown on the Fear & Greed page tells you which input moved. A greed reading built on momentum and turnover with poor breadth is one asset's rally — bitcoin doing the lifting — and is more fragile than the same score with broad participation.
Pair it with the market it describes. Bitcoin's recent price path is the largest single input, so read the two together:
 BitcoinBTCPrice, last 90 days+40.91%
What it is not
- Not a timing signal. Extreme greed has preceded corrections and has also persisted for months while prices doubled. It tells you the crowd is positioned one way, not when that changes.
- Not a measure of your own risk. It says nothing about leverage, funding or open interest, which are covered in the derivatives track and are far better guides to how violently a move could unwind.
- Not comparable to other indices. A 60 on Coinmico's scale and a 60 elsewhere are computed from different inputs. Compare each index to its own history, not to another's.
What this means in practice
- Use the index to name the regime, then check breadth and dominance to see how solid it is.
- Take extreme readings as a prompt to examine positioning — yours and the market's — not as instructions.
- Prefer an index whose inputs you can check. If you cannot find the method, you cannot know what the number means.
Where to go from here
You have finished the Reading market data track. The Trading & derivatives track begins with order types and builds up to perpetual futures, funding and liquidations — the mechanics that turn sentiment into violent price moves.
Assets in this piece
 Bitcoin
Every figure here is measured by Coinmico across the venues and chains we index. See our methodology.