How to read a crypto market recap: a real example
A daily recap is a snapshot, not a forecast. Learn how market cap, breadth, volume, leverage, sentiment and sector moves fit together in Coinmico's measured example.
What You Will Learn
- "Read market cap with breadth: a small index move can hide a market where most assets fell."
- "Spot volume, derivatives volume, open interest and liquidations answer different questions; do not treat them as interchangeable."
- "A sector spread and top-100 movers show where a broad market move was concentrated, while keeping thin small caps out of the comparison."
A crypto market recap is a one-day snapshot of the whole market, measured over the 24 hours that just closed at 00:00 UTC. It brings several kinds of information together: prices, participation, trading activity, derivatives positioning, sentiment and the assets or sectors that stood out. It is a record of what happened, not a forecast of what comes next.
One headline number cannot tell the whole story. A nearly flat market-cap index can hide falling breadth, strength in a few sectors, or a different direction in derivatives activity. Read the recap in order, then compare the parts rather than treating any one figure as a signal by itself.
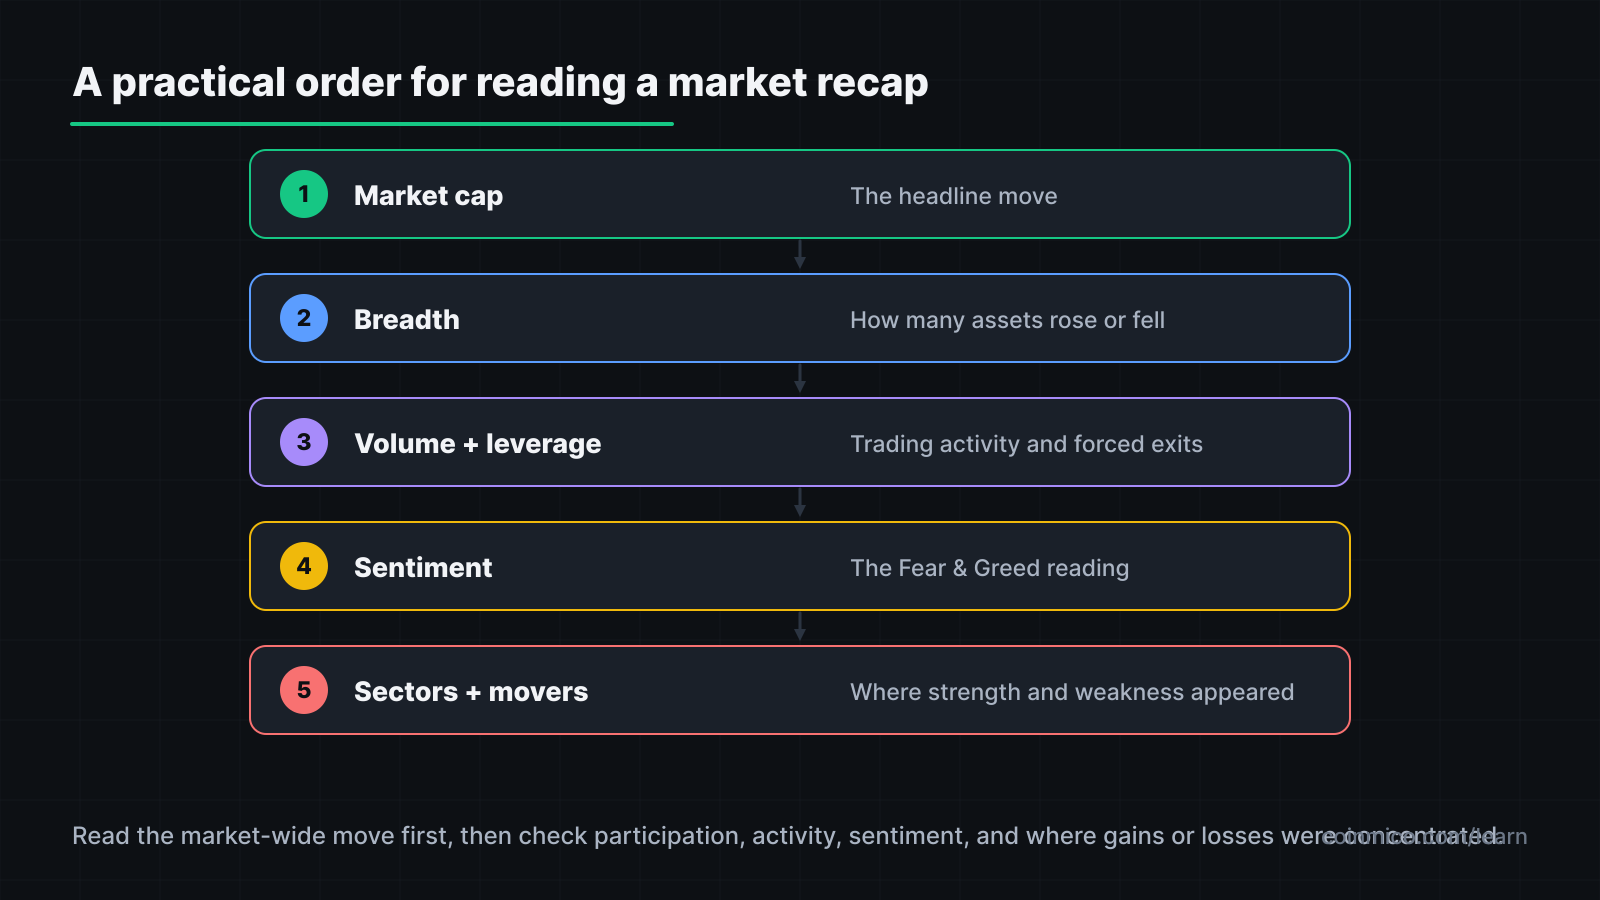
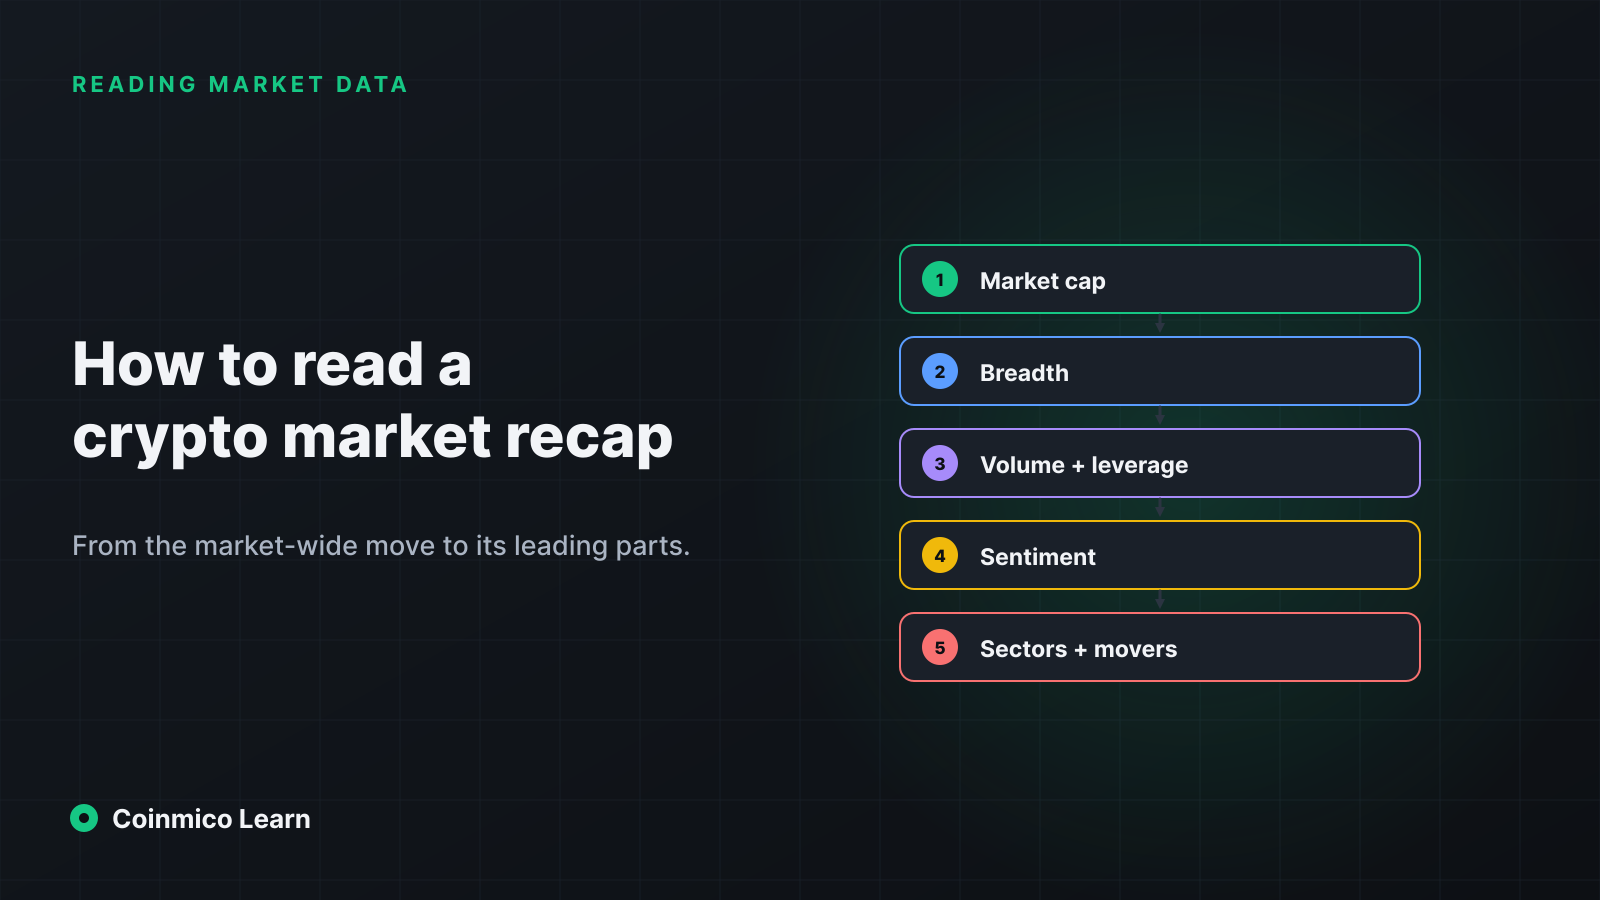
_A useful reading order moves from the market-wide headline to participation, activity, sentiment, and the strongest or weakest parts of the market._
What a crypto market recap is
The daily recap combines measurements from across the market into one UTC-day view. Coinmico's recap uses its own index and collected market data, rather than copying figures from another data site. The Methodology page explains how prices, market cap and volume are measured.
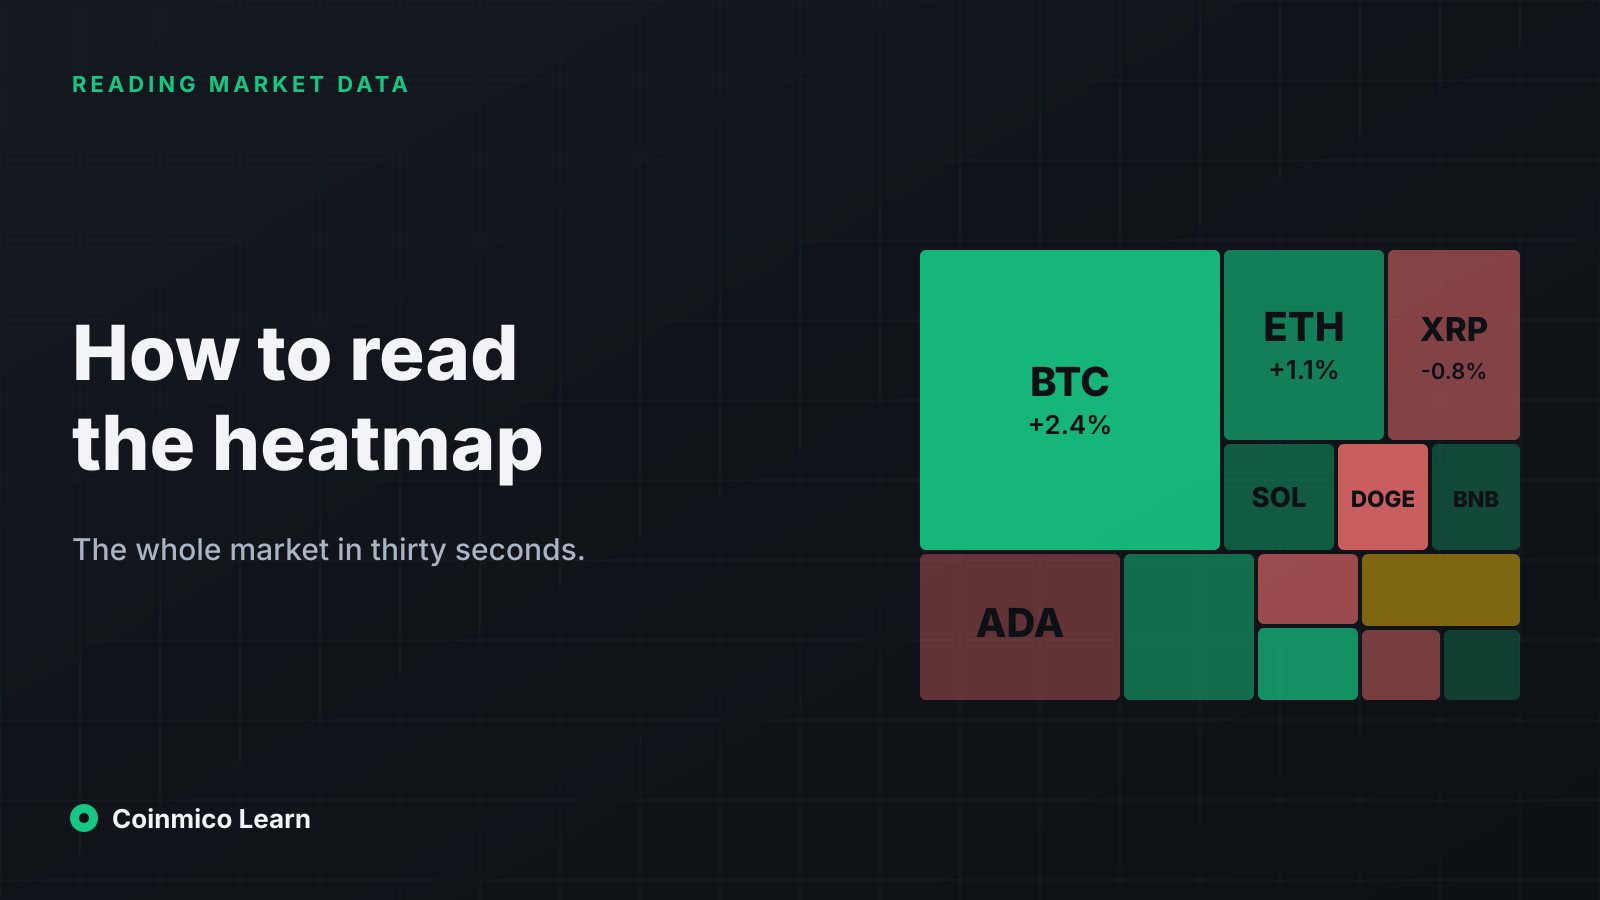
The recap is useful when you want a compact overview before looking at a particular asset. The Global page shows the broader market view, while the Heatmap makes relative moves easier to scan. Use those pages to investigate a pattern, not to replace the recap's definitions or timestamps.
Read market cap with its 24-hour change
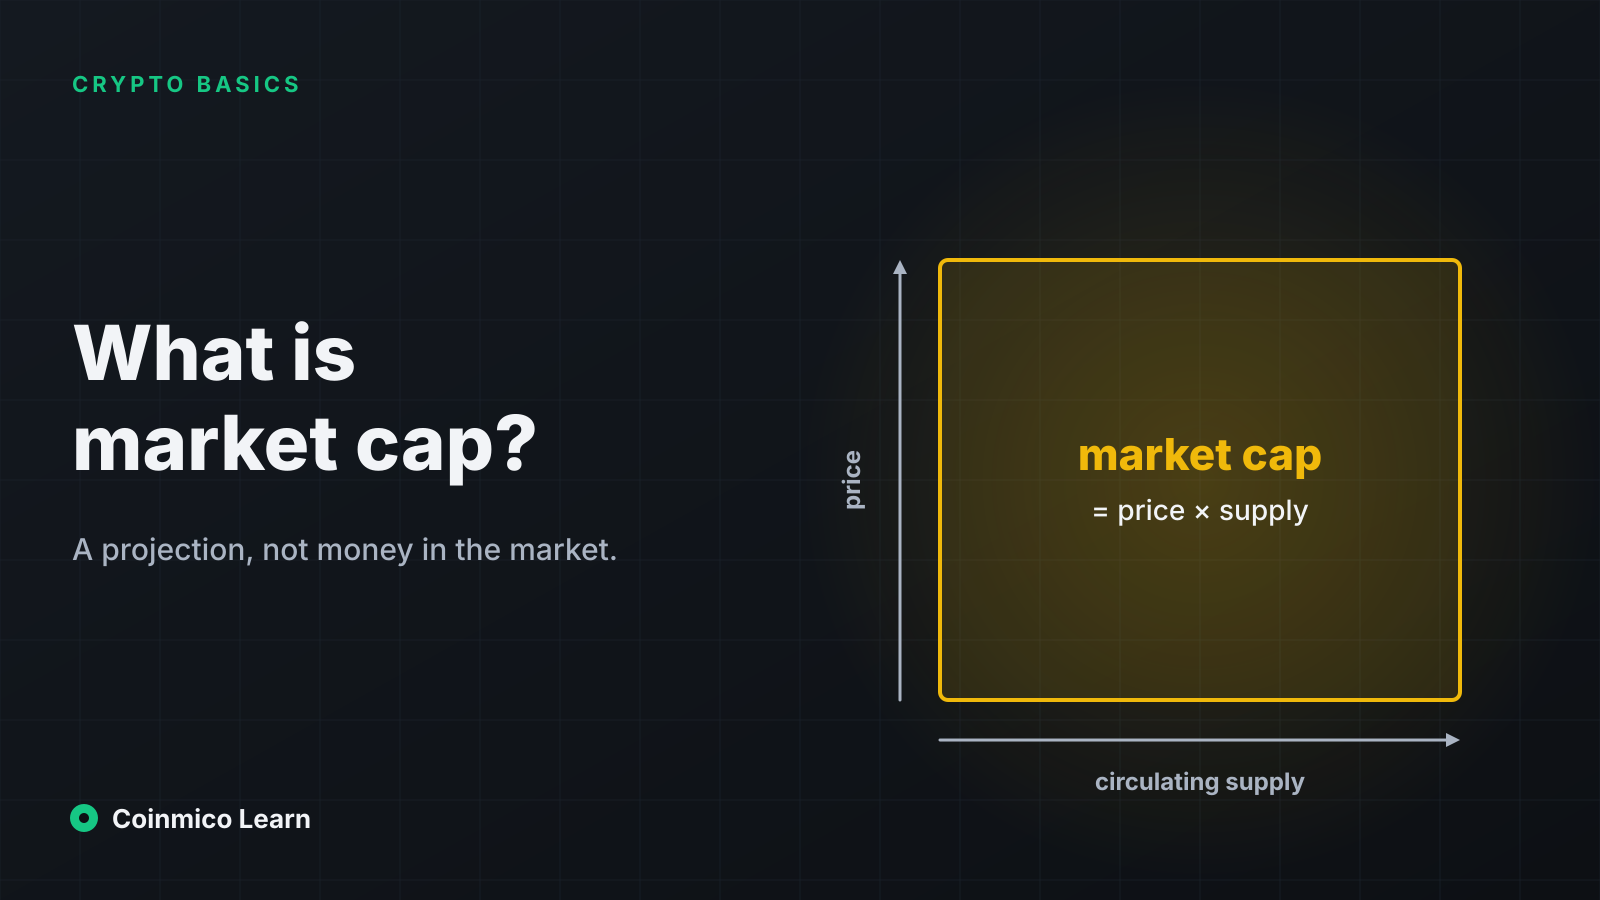
Total market cap is the headline value of the assets included in the index. Its 24-hour change tells you whether their combined measured value rose or fell over the recap window. A small move can sound calm, but it does not mean every asset moved by a similar amount. Gains in some assets can offset losses in others, leaving the index close to flat while leadership rotates underneath.
Check the measurement window before comparing recaps. A daily change covers the UTC day that just ended; it is not a forecast, and it may not line up with a local calendar day. Then look at breadth and sector performance to see whether the headline move was widely shared.
Bitcoin dominance shows market share
Bitcoin dominance is Bitcoin's share of the total market cap in the index. A rising reading means Bitcoin is gaining share relative to the rest of the measured market; a falling reading means the rest is gaining share relative to Bitcoin. Neither direction alone says whether Bitcoin's price rose or fell. The ratio can change because Bitcoin moved, because other assets moved, or both.
Compare dominance with Bitcoin's own daily price change and with breadth. Bitcoin dominance, breadth and altcoin season explains why this share is a relative measure, not a direct count of how many coins are outperforming.
Breadth shows how widely a move was shared
Breadth counts how many assets rose and how many fell in the measurement window. The recap also shows the share of the 100 largest assets that rose. A weak reading can reveal broad selling even when the total index is only slightly down, because a few large assets may offset declines elsewhere.
The all-asset count and the top-100 share answer related but different questions. Smaller assets can be thinly traded, so an isolated move may not represent the wider market. The top-100 filter focuses the comparison on a consistent group of larger assets; it does not describe every token or every venue.
Volume and leverage tell different stories
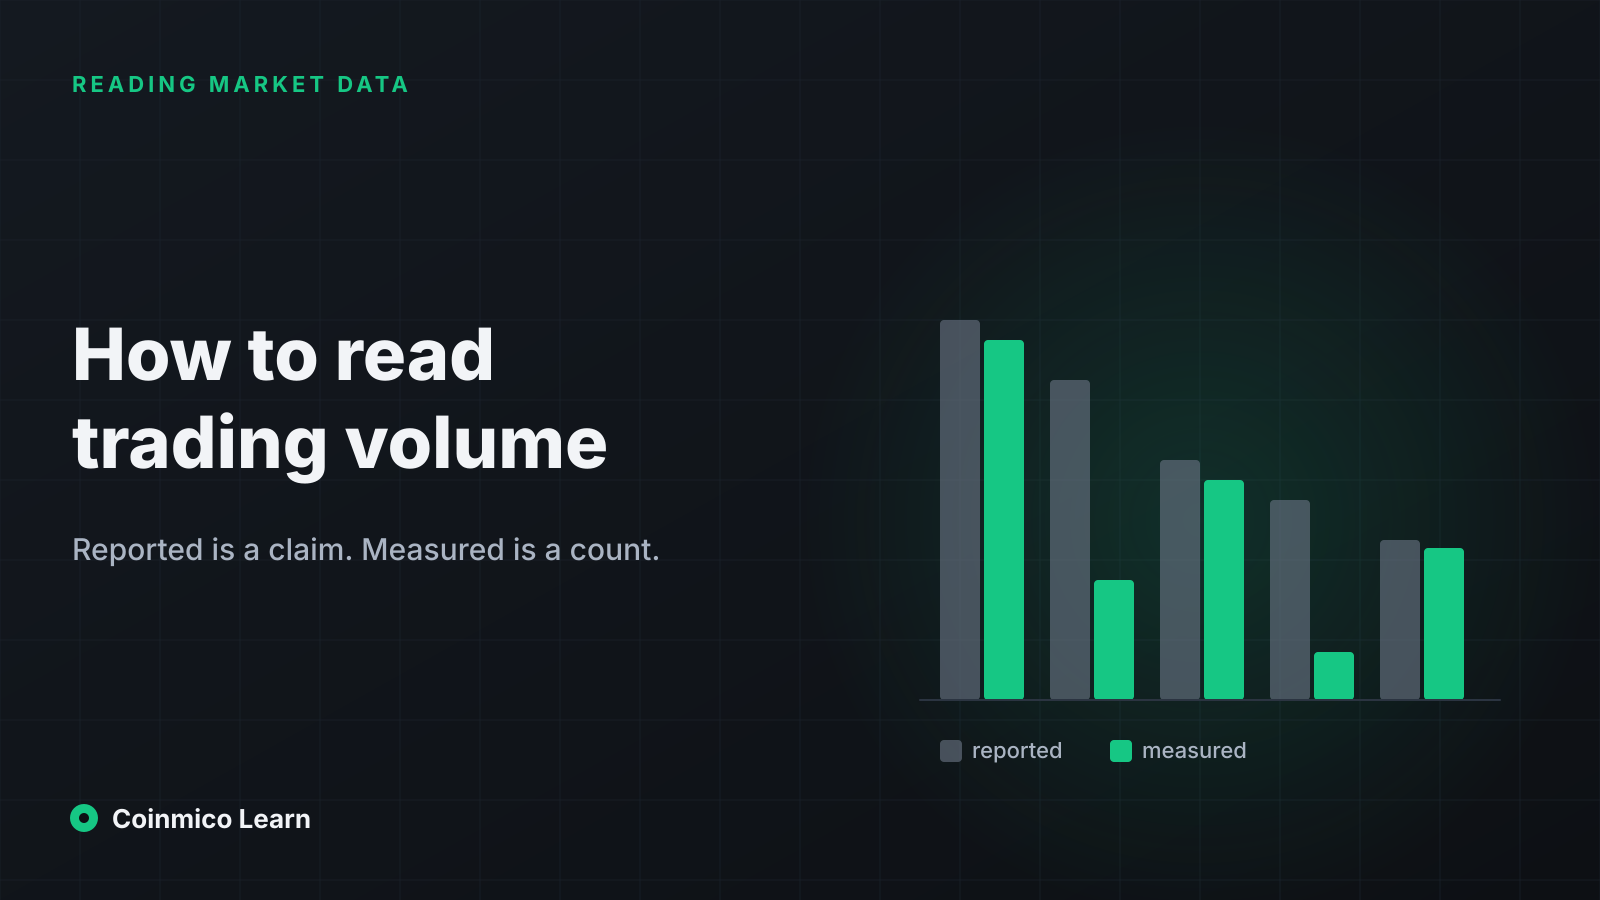
Spot volume records completed buying and selling of the asset itself. Coinmico separates centralised-exchange spot activity from on-chain swaps, then reports derivatives volume separately. These measures cover different venues and trade types; do not add them together or assume that a high derivatives total means the same thing as high spot demand. How to Read Trading Volume explains what volume can and cannot show.
Open interest is the outstanding derivatives positioning, not the amount traded during the day. Liquidations are positions closed automatically after their margin can no longer support them. The recap splits liquidations between longs and shorts, which helps show which side was affected more. A large liquidation total can point to forced position reduction, but the number alone does not explain why the market moved. See Liquidations Explained and the live Liquidations page for more context.
Sentiment is a separate signal
The Coinmico Fear & Greed index gives a daily sentiment reading. Read its level alongside its change from the prior day and its value a week earlier. A level describes the current classification; the comparisons show whether sentiment has shifted. Neither tells you where prices must go next.
The Fear & Greed page shows the current index, and Fear & Greed Index Explained describes how to interpret the measure. In a recap, treat sentiment as context alongside prices, breadth and activity rather than as a trading instruction.
Sectors and movers put the move in context
Sector performance shows which parts of the market gained or lost. The difference between the strongest and weakest tracked sectors is the sector spread. A wider spread means performance was more uneven; a narrow total-index move can still contain pronounced rotation between sectors.
The top-100 gainers and losers identify assets with the largest measured moves within that group. The filter makes comparisons less vulnerable to thin, small-cap outliers, but it is still a selection: it does not include every listed asset. The Heatmap is useful for scanning those relative moves, while the recap keeps the reported window and ranking together.
A worked example: 7 November 2026
The Coinmico recap for 7 November 2026 recorded a market cap of $2.61T, down 0.4% on the day. Bitcoin was $75,789, down 0.2%; its dominance was 58.4%, up 0.09 percentage points. Ether was $2,236, also down 0.2%.
- Breadth: 738 assets rose and 1,696 fell; 24.0% of the 100 largest assets rose.
- Volume and positioning: spot volume was $21.0B. Derivatives volume was $49.1B, and open interest was $62.4B.
- Liquidations: $44.0M in total, with $29.8M from longs and $14.1M from shorts.
- Sentiment: Fear & Greed was 51 (Neutral), up 1 point from the previous day and below 57 a week earlier.
- Sectors: of 10 tracked sectors, 1 rose and 9 fell. Exchange Tokens led at +0.1%; Zero Knowledge was weakest at −4.5%, a 4.6-point spread. DeFi was in the middle at −0.7%.
- Top-100 movers: Midnight (NIGHT) rose 3.2% and Uniswap (UNI) 3.0%; Pump.fun (PUMP) fell 6.2% and Bitcoin Cash (BCH) 5.7%.
The recap covered 56 exchanges and 37 decentralised venues. Those coverage counts describe the measured data set, not every market where an asset can trade.
What this means in practice
The market-cap decline was small, but breadth was weak: far fewer than half of the top 100 rose, and the overall asset count also had more decliners than advancers. The sector spread shows that strength and weakness were uneven. Together, those figures point to rotation and quiet selling beneath a nearly flat headline.
Liquidations were modest and long-heavy, which does not suggest a broad forced-deleveraging event in this recap. Sentiment remained Neutral, with a small day-over-day increase but a lower reading than a week earlier. These are complementary descriptions of the same window; none is a standalone explanation or a promise about the next one.
A 60-second reading checklist
- Start with the UTC date, market cap and its 24-hour change.
- Compare the all-asset up/down count with the share of the top 100 that rose.
- Separate spot, on-chain and derivatives volume; read open interest and long/short liquidations alongside them.
- Check the Fear & Greed level against its daily and weekly comparisons.
- Look at the sector spread and top-100 movers, then open the Global page, Heatmap or Methodology page if you need detail.
Find the latest daily recap and the weekly view on the Recap page; every recap is also available through its RSS feed. For a complete view, use the Recap archive, compare the Bitcoin price page with the Ethereum price page, and keep each figure's measurement window in view.
Next in this track
Continue with Bitcoin dominance, breadth and altcoin season to see how a relative market-share measure complements the daily recap.
Every figure here is measured by Coinmico across the venues and chains we index. See our methodology.